Assembling the heterogeneous elements for (digital) learning

Category: irac Page 1 of 2

Improving teacher awareness, action and reflection on learner activity

The following post contains the content from a poster designed for the 2017 USQ Toowoomba L&T celebration event. It provides some rationale for a technology demonstrator at USQ based on the Moodle Activity Viewer.

What is the problem?

Learner engagement is a key to learner success. Most definitions of learner engagement include “actively participating, interacting, and collaborating with students, faculty, course content and members of the community” (Angelino & Natvig, 2009, p. 3).

70% of USQ students study online. By mid-November 2017, 26,754 students had been active in USQ’s Moodle LMS.

In online learning, the absence of visual cues makes teacher awareness of student activity difficult (Govaerts, Verbert, & Duval, 2011).  Richardson (2011) identifies “the role which teaching staff play in inspiring, challenging and engaging students” as “perhaps the most woefully neglected aspect of quality in higher education” (p. 2)

Learning analytics (LA) is the “use of (big) data to provide actionable intelligence for learners and teachers” (Ferguson, 2014). However, current tools provide poor data aggregation, poor visualisation capabilities and have other limitations that inhibit teachers’ ability to: understand student activity; respond appropriately; and, reflect on course design (Dawson & McWilliam, 2008; Corrin et al, 2013; Jones, & Clark, 2014).

How will it be addressed?

Teachers can be supported through tools that help them “analyse, appraise and improve practices in their everyday activity systems” (Knight et al, 2016, p. 337).

This Technology Demonstrator has implemented and will customise and scaffold the use of the Moodle Activity Viewer (MAV) within the USQ activity system.

The MAV provides a useful and easy to use tool that provides representations of student activity from within all Moodle learning spaces. It provides affordances to support teacher intervention and further analysis.

MAV - How many students

MAV’s overlay answering the question how many and what percentage of students have accessed each Moodle activity & resource?

What are the expected outcomes?

The project aims to explore two questions:

  1. If and how does the provision of contextual, useful, and easy to use representations of online learner activity help teachers analyse, appraise and improve their practices?
  2. If and how does this change in teacher activity influence learner activity and learning outcomes?

MAV - How many clicks

MAV’s overlay answering the question how many times have those students clicked on each Moodle activity & resource?

Want to learn more?

Ask for a demostration of MAV during the poster session.

USQ staff can learn more* about and start using MAV from http://tiny.cc/aboutmav and http://tiny.cc/installmav

* (Only from a USQ campus or via the USQ VPN)

MAV - How many students in a forum

MAV’s overlay answering the question how many and what percentage of students have read posts in this introductory activity?

MAV - Who accessed and how to contact them

MAV’s student access dialog providing details of and enabling teacher contact with the students who have accessed the “Fix my class IWB” forum?

References

Angelino, L. M., & Natvig, D. (2009). A Conceptual Model for Engagement of the Online Learner. Journal of Educators Online, 6(1), 1–19.

Corrin, L., Kennedy, G., & Mulder, R. (2013). Enhancing learning analytics by understanding the needs of teachers. In Electric Dreams. Proceedings ascilite 2013 (pp. 201–205).

Dawson, S., & McWilliam, E. (2008). Investigating the application of IT generated data as an indicators of learning and teaching performance. Queensland University of Technology and the University of British Columbia.

Ferguson, R. (2014). Learning analytics FAQs. Education. Retrieved from https://www.slideshare.net/R3beccaF/learning-analytics-fa-qs

Govaerts, S., Verbert, K., & Duval, E. (2011). Evaluating the Student Activity Meter: Two Case Studies. In Advances in Web-Based Learning – ICWL 2011 (pp. 188–197). Springer, Berlin, Heidelberg. https://doi.org/10.1007/978-3-642-25813-8_20

Jones, D., & Clark, D. (2014). Breaking BAD to bridge the reality/rhetoric chasm. In B. Hegarty, J. McDonald, & S.-K. Loke (Eds.), Proceedings of the 31st Annual Conference of the Australasian Society for Computers in Learning in Tertiary Education (ASCILITE 2014) (pp. 262–272). Sydney, Australia: Macquarie University.

Knight, P., Tait, J., & Yorke, M. (2006). The professional learning of teachers in higher education. Studies in Higher Education, 31(3), 319–339. https://doi.org/10.1080/03075070600680786

Learning analytics, quality indicators and meso-level practitioners

When it comes to research I’ve been a bit of failure, especially when measured against some of the more recent strategic and managerial expectations. Where are those quartile 1 journal articles? Isn’t your h-index showing a downward trajectory?

The concern generated by these quantitative indicators not only motivated the following ideas for a broad research topic, but also is one of the issues to explore within the topic. The following outlines early attempts to identify a broader research topics that is relevant enough for current sector and institutional concerns; provides sufficient space for interesting research and contribution; aligns nicely (from one perspective) with my day job; and, will likely provide a good platform for a program of collaborative research.

The following:

  1. explains the broad idea for research topic within the literature; and,
  2. describes the work we’ve done so far including two related examples of the initial analytics/indicators we’ve explored.

The aim here is to be generative. We want to do something that generates mutually beneficial collaborations with others. If you’re interested, let us know.

Research topic

As currently defined the research topic is focused around the design and critical evaluation of the use and value of a learning analytics platform to support meso-level practitioners in higher education to engage with quality indicators of learning and teaching.

Amongst the various aims, are an intent to:

  • Figure out how to design and implement an analytics platform that is useful for meso-level practitioners.
  • Develop design principles for that platform informed by the analytics research, but also ideas from reproducible research and other sources.
  • Use and encourage the use by others of the platform to:
    1. explore what value (if any) can be extracted from a range of different quality indicators;
    2. design interventions that can help improve L&T; and,
    3. to enable for a broader range of research – especially critical research – around the use of quality indicators and learning analytics for learning and teaching.

Quality Indicators

The managerial turn in higher education has increased the need for and use of various indicators of quality, especially numeric indicators (e.g. the number of Q1 journal articles published, or not). Kinash et al (2015) state the quantifiable performance indicators are important to universities because they provide “explicit descriptions of evidence against which quality is measured” (p. 410). Chalmers (2008) offers the following synthesized definition of performance indicators

measures which give information and statistics context; permitting comparisons between fields, over time and with commonly accepted standards. They provide information about the degree to which teaching and learning quality objectives are being met within the higher education sector and institutions. (p. 10)

However, the generation and use of these indicators is not without issues.

There is also a problem with a tendency to rely on quantitative indicators. Quantitative indicators provide insight into “how much or how many, but say little about quality” (Chalmers & Gardiner, 2015, p. 84). Ferguson and Clow (2017) – writing in the context of learning analytics – argue the good quality qualitative research needs to support good-quality quantitative research because “we cannot understand the data unless we understand the context”. Similarly, Kustra et al (2014) suggest that examining the quality of teaching requires significant qualitative indicators to “provide deeper interpretation and understanding of the measured variable”. Qualitative indicators are used by Universities to measure performance in terms of processes and outcomes,however, “because they are more difficult to measure and often produce tentative results, are used less frequently” (Chalmers & Gardiner, 2015, p. 84)

Taking a broader perspective there are problems such as Goodhart’s law and performativity. As restated by Strathern (1997), Goodhart’s Law is ‘When a measure becomes a target, it ceases to be a good measure’ (p. 308) Elton (2004) describes Goodhart’s Law as “a special case of Heisenberg’s Uncertainty Principle in Sociology, which states that any observation of a social system affects the system both before and after the observation, and with unintended and often deleterious consequences” (p. 121). When used for control and comparison purposes (e.g league tables) indicators “distort what is measured, influence practice towards what is being measured and cause unmeasured parts to get neglected” (Elton, 2004, p. 121).

And then there’s the perception that quality indicators and potentially this whole research project becomes an unquestioning part of part of performativity and all of the issues that generates. Ball (2003) outlines the issues and influence of the performative turn in institutions. He describes performativity as

a technology, a culture and a mode of regulation that employs judgements, comparisons and displays as means of incentive, control, attrition and change ^ based on rewards and sanctions (both material and symbolic). The performances (of individual subjects or organizations) serve as measures of productivity or output, or displays of ‘quality’, or ‘moments’ of promotion or inspection (Ball, 2003, p. 216)

All of the above (and I expect much more) all point to there being interesting and challenging questions to explore and answer around quality indicators and beyond. I do hope that any research we do around this topic engages with the necessary critical approach to this research. As I re-read this post now I can’t help but see echoes of a previous discussion Leigh and I have had around inside out, outside in, or both. This approach is currently framed as an inside out approach. An approach where those inside the “system” are aware of the constraints and work to address those. The question remains whether this is possible.

Learning analytics

Siemens and Long (2011) define LA as “the measurement, collection, analysis and reporting of data about learners and their contexts, for purposes of understanding and optimizing learning and the environments in which it occurs” (p. 34). The dominant application of learning analytics has focused on “predicting student learning success and providing proactive feedback” (Gasevic, Dawson and Siemens, 2015), often driven by an interest in increasing student retention and success. Colvin et al (2016) found two distinct trajectories of activity in learning analytics within Australian higher education. The first were ultimately motivated by measurement and retention implemented specific retention related learning analytics programs. The second saw retention as a consequence of the broader learning and teaching experience and “viewed learning analytics as a process to bring understanding to learning and teaching practices” (Colvin et al, 2016, p. 2).

Personally, I’m a fan of the second trajectory and see supporting that trajectory as a major aim for this project.

Not all that surprisingly, learning analytics has been applied to the question of quality indicators. Dawson and McWilliam (2008) explored the use of “academic analytics” to

address the need for higher education institutions (HEIs) to develop and adopt scalable and automated measures of learning and teaching performance in order to evaluate the student learning experience (p. 1)

Their findings included (emphasis added):

  • “LMS data can be used to identify significant differences in pedagogical approaches adopted at school and faculty levels”
  • “provided key information for senior management for identifying levels of ICT adoption across the institution, ascertaining the extent to which teaching approaches reflect the strategic institutional priorities and thereby prioritise the allocation of staff development resources
  • refining the analysis can identify “further specific exemplars of online teaching” and subsequently identify “‘hotspots’ of student learning engagement”; “provide lead indicators of student online community and satisfaction”; and, identify successful teaching practices “for the purposes of staff development activities and peer mentoring”

Macfadyen and Dawson (2012) provide examples of how learning analytics can reveal data that offer “benchmarks by which the institution can measure its LMS integration both over time, and against comparable organizations” (p. 157). However, the availability of such data does not ensure use in decision making. Macfadyen and Dawson (2012) also report that the availability of patterns generated by learning analytics did not generate critical debate and consideration of the implications of such data by the responsible organisational committee and thus apparently failed to influence institutional decision-making.

A bit more surprising, however, is that in my experience there doesn’t appear to have been a concerted effort to leverage learning analytics for these purposes. Perhaps this is related to findings from Colvin et al (2016) that even with all the attention given to learning analytics there continues to be: a lack of institutional exemplars; limited resources to guide implementation; and perceived challenges in how to effectively scale learning analytics across an institution. There remains little evidence that learning analytics has been helpful in closing the loop between research and practice, and made an impact on university-wide practice (Rogers et al, 2016).

Even if analytics is used, there are other questions such as the role of theory and context. Gasevic et al (2015) argue that while counting clicks may provide indicators of tool use it is unlikely to reveal insights of value for practice or the development of theory. If learning analytics is to achieve an a lasting impact on student learning and teaching practice it will be necessary to draw of appropriate theoretical models (Gasevic et al, 2015). Rogers et al (2016) illustrate how such an approach “supports an ever-deepening ontological engagement that refines our understanding and can inform actionable recommendations that are sensitive to the situated practice of educators” (p. 245). If learning analytics aims to enhance to learning and teaching, it is crucial that it engages with teachers and their dynamic contexts (Sharples et al., 2013). Accounting for course and context specific instructional conditions and learning designs are increasingly seen as imperatives for the use of learning analytics (Gaservic et al, 2015; Lockyer et al, 2013)

There remain many other questions about learning analytics. Many of those questions are shared with the use of quality indicators. There is also the question of how learning analytics can harnessed via means that are sustainable, scale up, and at the same time provide contextually appropriate support. How can the tensions between the need for institutional level quality indicators of learning and teaching, and the inherently contextually specific nature of learning and teaching?

Meso-level practitioners

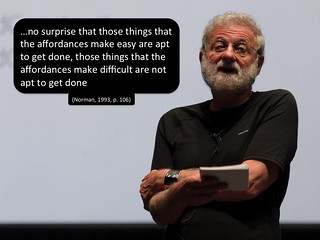
The limited evidence of impact from learning analytics on learning and teaching practice may simply be a mirror of the broader difficulty that universities have had with other institutional learning technologies. Hannon (2013) explains that when framed as a technology project the implementation of institutional learning technologies “risks achieving technical goals accompanied by social breakdowns or failure, and with minimal effect on teaching and learning practices” (p. 175). Breakdowns that arise, in part, from the established view of enterprise technologies. A view that sees enterprise technologies as unable to be changed, and “instead of optimizing our machines for humanity – or even the benefit of some particular group – we are optimizing humans for machinery” (Rushkoff, 2010, p. 15).

Jones et al (2006) describe the term meso-level to describe the “level that was intermediate between small scale, local interaction, and large-scale policy and institutional procesess” (p. 37). Hannon (2013) describes meso-level practitioners as the “teaching academics, learning technologists, and academic developers” (p. 175) working between the learning and teaching coal-face and the institutional context defined by an institution’s policies and technological systems. These are the people who can see themselves as trying to bridge the gaps between the institutional/technological vision (macro-level) and the practical coal-face realities (micro-level). These are the people who are often required to help “optimise humans for machinery”, but who would generally prefer to do the reverse. Hannon (2013) also observes thateEven though there has been significant growth in the meso-level within contemporary higher education, research has continued to largely focused on the macro or micro levels.

My personal experience suggests that the same can be said about the design and use of learning analytics. Most institutional attempts are focused at either the macro or micro level. The macro level focused largely on large-scale student retention efforts. The micro level focused on the provision of learning analytics dashboards and other tools to teaching staff and students. There has been some stellar work by meso-level practitioners in developing supports for the micro-level (e.g. Liu, Bartimote-Aufflick, Pardo, & Bridgeman, 2017). However, much of this work has been in spite of the affordances and support offered by the macro-level. Not enough of the work, beyond the exceptions already cited, appears to have actively attempted to help optimise the machinery for the humans. In addition, there doesn’t appear to be a great deal of work – beyond the initial work from almost 10 years ago – focused on if and how learning analytics can help meso-level practitioners in the work that they do.

As a result there are sure to be questions to explore about meso-level practitioners, their experience and impact on higher education. Leigh Blackall has recently observed that the growth in meso-level practitioners in the form of “LMS specialists and ed tech support staff” comes with the instruction that they “focus their attentions on a renewed sense of managerial oversight”. Implicating meso-level practitioners in questions related to performativity etc. Leigh also positions these meso-level practitioners as examples of disabling professions. Good pointers to some of the more critical questions to be asked about this type of work.

Can meso-level practitioners break out, or are we doomed to be instruments of performativity? What might it take to break free? How can learning analytics be implemented in a way that allows it to be optimised for the contextually specific needs of the human beings involved, rather than require the humans to be optimised for the machinery? Would such a focus improve the quality of L&T?

What have we done so far?

Initial work has focused on developing an open, traceable, cross-institutional platform for exploring learning analytics. In particular, exploring how recent ideas such as reproducible research and insights from learning analytics might help design a platform that enables meso-level practitioners to break some of the more concerning limitations of current practice.

We’re particularly interested in ideas from Elton (2004) where bottom-up approaches might “be considerably less prone to the undesirable consequences of Goodhart’s Law” (p. 125). A perspective that resonates with our four paths idea for learning analytics. i.e. That it’s more desirable and successful to follow the do-it-with learners and teachers or learner/teacher DIY paths.

The “platform” is seen as an enabler for the rest of the research program. Without a protean technological platform – a platform we’re able to tailor to our requirements – it’s difficult to see how we’d be able to effectively support the deeply contextual nature of learning and teaching or escape broader constraints such as performativity. This also harks back to my disciplinary background as a computer scientist. In particular, the computer scientist as envisioned by Brooks (1996) as a toolsmith whose delight “is to fashion powertools and amplifiers for minds” (p. 64) and who “must partner with those who will use our tools, those whose intelligences we hope to amplify” (p. 64).

First steps

As a first step, we’re revisiting our earlier use of Malikowski, Thompson & Theis (2007) to look at LMS usage (yea, not that exciting, but you have to start somewhere). We’ve developed a set of Python classes that enable the use of the Malikowski et al (2007) LMS research model. That set of classes has been used to develop a collection of Jupyter notebooks that help explore LMS usage in a variety of ways.

The theory is that these technologies (and the use of github to share the code openly) should allow anyone else to perform these same analysis with their LMS/institution. So far, the code is limited to working only with Moodle. However, we have been successful in sharing code between two different installations of Moodle. i.e. one of us can develop some new code, share it via github, and the other can run that code over their data. A small win.

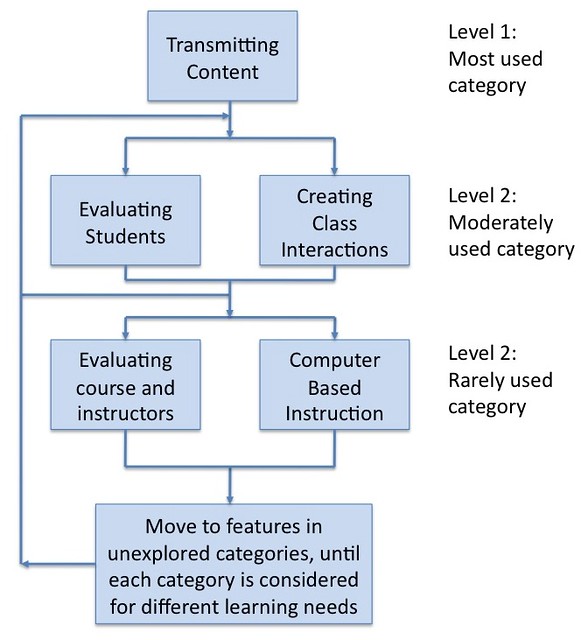
The Malikowski et al (2007) model groups LMS features by the following categories: Content, Communication, Assessment, Evaluation and Computer-Based Instruction. It also suggests that tool use occurs in a certain order and with a certain frequency. The following figure (click on it to see a larger version) is a representation of the Malikowski model.

Malikowski Flow Chart

Looking for engagement?

Dawson and McWilliam (2008) suggested that academic analytics could be used to identify “potential “hotspots” of student learning engagement” (p. 1). Assuming that the number of times students click within an LMS course is a somewhat useful proxy for engagement (a big question), then this platform might allow you to:

  1. Select a collection of courses.

    This might be all the courses in a discipline that scored well (or poorly) on some other performance indicator, all courses in a semester, all large first year courses, all courses in a discipline etc.

  2. Visualise the number of total student clicks within each course clicked on LMS functionality in each of the Malikowski categories.
  3. Visualise the number of clicks per student within each course in each Malikowski category.

These visualisations might then provide a useful indication of something that is (or isn’t) happening. An indication that would not have been visible otherwise and is worthy of further exploration via other means (e.g. qualitative).

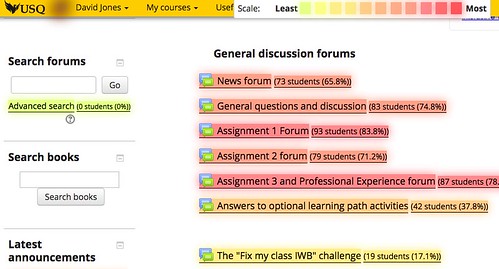
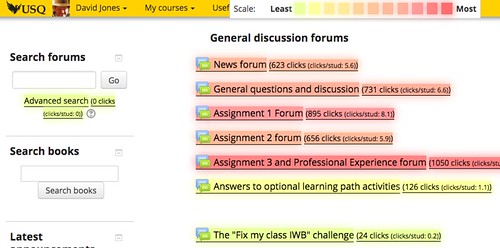
The following two graphs were generated by our platform and are included here to provide a concrete example of the above process. Some features of the platform that the following illustrates

  • It generates artefacts (e.g. graphs, figures) that can be easily embedded anywhere on the web (e.g. this blog post). You don’t have to be using out analytics platform to see the artefacts.
  • It can anonymise data for external display. For example, courses in the following artefacts have been randomly given people’s names rather than course codes/names.

Number of total student clicks

The first graph shows a group of 7 courses. It shows the number of students enrolled in each course (e.g. the course Michael has n=451) and the bars represent the total number of clicks by enrolled students on the course website. The clicks are grouped according to the Malikowski categories. If you roll your mouse over one of the bars, then you should see displayed the exact number of clicks for each category.

For example, the course Marilyn with 90 students had

  • 183,000+ clicks on content resources
  • 27,600+ clicks on communication activities
  • 5659 clicks on assessment activities
  • and 0 for evaluation of CBI

Total number of clicks isn’t all that useful for course comparisons. Normalising to clicks per enrolled student might be useful.


Clicks per student

The following graph uses the same data as above, however, the number of clicks is now divided by the number of enrolled students. A simple change in analysis that highlights differences between courses.

2000+ clicks on content per student certainly raises some questions about the Marilyn course. Whether that number is good, bad, or meaningless would require further exploration.


What’s next?

We’ll keep refining the approach, some likely work could include

  • Using different theoretical models to generate indicators.
  • Exploring how to effectively supplement the quantitative with qualitative.
  • Exploring how engaging with this type of visualisation might be a useful as part of professional learning.
  • Exploring if these visualisations can be easily embedded within the LMS, allowing staff and students to see appropriate indicators in the context of use.
  • Exploring various relationships between features quantitatively.

    For example, is there any correlation between results on student evaluation and Malikowski or other indicators? Correlations between disciplines or course design?

  • Combining the Malikowski model with additional analysis to see if it’s possible to identify significant changes in the evolution of LMS usage over time.

    e.g. to measure the impact of organisational policies.

  • Refine the platform itself.

    e.g. can it be modified to support other LMS?

  • Working with a variety of people to explore what different questions they might wish to answer with this platform.
  • Using the platform to enable specific research project.

And a few more.

Want to play? Let me know. The more the merrier.

References

Ball, S. J. (2003). The teacher’s soul and the terrors of performativity. Journal of Education Policy, 18(2), 215–228. https://doi.org/10.1080/0268093022000043065

Brooks, F. (1996). The Computer Scientist as Toolsmith II. Communications of the ACM, 39(3), 61–68.

Chalmers, D. (2008). Indicators of university teaching and learning quality.

Chalmers, D., & Gardiner, D. (2015). An evaluation framework for identifying the effectiveness and impact of academic teacher development programmes. Studies in Educational Evaluation, 46, 81–91. https://doi.org/10.1016/j.stueduc.2015.02.002

Colvin, C., Wade, A., Dawson, S., Gasevic, D., Buckingham Shum, S., Nelson, K., … Fisher, J. (2016). Student retention and learning analytics : A snapshot of Australian practices and a framework for advancement. Canberra, ACT: Australian Government Office for Learning and Teaching. Retrieved from http://he-analytics.com/wp-content/uploads/SP13-3249_-Master17Aug2015-web.pdf

Dawson, S., & McWilliam, E. (2008). Investigating the application of IT generated data as an indicators of learning and teaching performance. Queensland University of Technology and the University of British Columbia.

Elton, L. (2004). Goodhart’s Law and Performance Indicators in Higher Education. Evaluation & Research in Education, 18(1–2), 120–128. https://doi.org/10.1080/09500790408668312

Ferguson, R., & Clow, D. (2017). Where is the Evidence?: A Call to Action for Learning Analytics. In Proceedings of the Seventh International Learning Analytics & Knowledge Conference (pp. 56–65). New York, NY, USA: ACM. https://doi.org/10.1145/3027385.3027396

Gašević, D., Dawson, S., & Siemens, G. (2015). Let’s not forget: Learning analytics are about learning. TechTrends, 59(1), 64–71. https://doi.org/10.1007/s11528-014-0822-x

Gašević, D., Dawson, S., Rogers, T., & Gasevic, D. (2015). Learning analytics should not promote one size fits all: The effects of instructional conditions in predicating learning success. The Internet and Higher Education, 28, 68–84. https://doi.org/10.1016/j.iheduc.2015.10.002

Hannon, J. (2013). Incommensurate practices: sociomaterial entanglements of learning technology implementation. Journal of Computer Assisted Learning, 29(2), 168–178. https://doi.org/10.1111/j.1365-2729.2012.00480.x

Jones, C., Dirckinck‐Holmfeld, L., & Lindström, B. (2006). A relational, indirect, meso-level approach to CSCL design in the next decade. International Journal of Computer-Supported Collaborative Learning, 1(1), 35–56. https://doi.org/10.1007/s11412-006-6841-7

Kinash, S., Naidu, V., Knight, D., Judd, M.-M., Nair, C. S., Booth, S., … Tulloch, M. (2015). Student feedback: a learning and teaching performance indicator. Quality Assurance in Education, 23(4), 410–428. https://doi.org/10.1108/QAE-10-2013-0042

Liu, D. Y.-T., Bartimote-Aufflick, K., Pardo, A., & Bridgeman, A. J. (2017). Data-Driven Personalization of Student Learning Support in Higher Education. In A. Peña-Ayala (Ed.), Learning Analytics: Fundaments, Applications, and Trends (pp. 143–169). Springer International Publishing.

Lockyer, L., Heathcote, E., & Dawson, S. (2013). Informing Pedagogical Action: Aligning Learning Analytics With Learning Design. American Behavioral Scientist, 57(10), 1439–1459. https://doi.org/10.1177/0002764213479367

Macfadyen, L., & Dawson, S. (2012). Numbers Are Not Enough. Why e-Learning Analytics Failed to Inform an Institutional Strategic Plan. Educational Technology & Society, 15(3), 149–163.

Malikowski, S., Thompson, M., & Theis, J. (2007). A model for research into course management systems: bridging technology and learning theory. Journal of Educational Computing Research, 36(2), 149-173.

Rogers, Tim, Dawson, Shane, & Gasevic, Dragan. (2016). Learning Analytics and the Imperative for Theory-Driven Research. In The SAGE Handbook of E-learning Research (2nd ed., pp. 232–250).

Rushkoff, D. (2010). Program or be programmed: Ten commands for a digital age. New York: OR Books.

Sharples, M., Mcandrew, P., Weller, M., Ferguson, R., Fitzgerald, E., & Hirst, T. (2013). Innovating Pedagogy 2013: Open University Innovation Report 2 (No. 9781780079370). Milton Keynes: UK. Retrieved from http://www.open.ac.uk/blogs/innovating/

Siemens, G., & Long, P. (2011). Penetrating the Fog: Analytics in Learning and Education. EDUCAUSE Review, 46(5). Retrieved from http://moourl.com/j6a5d

Strathern, M. (1997). “Improving ratings”: audit in the British University system. European Review, 5(3), 305–321. https://doi.org/10.1002/(SICI)1234-981X(199707)5:3<305::AID-EURO184>3.0.CO;2-4

Emedding plotly graphs in WordPress posts


Warning: WP_Syntax::substituteToken(): Argument #1 ($match) must be passed by reference, value given in /home/djones/public_html/blog/wp-content/plugins/wp-syntax/wp-syntax.php on line 383

Warning: WP_Syntax::substituteToken(): Argument #1 ($match) must be passed by reference, value given in /home/djones/public_html/blog/wp-content/plugins/wp-syntax/wp-syntax.php on line 383

Last year I started using with Perl to play with analytics around Moodle Book usage. This year, @beerc and I have been starting to play with Jupyter Notebooks and Python to play with analytics for meso-level practitioners (Hannon, 2013). Plotly provides a fairly useful platform for generating graphs of various types and sharing the data. Works well with a range of languages and Jupyter Notebooks.

Question here is how well it works with WordPress. WordPress has some (understandable) constraints around embedding external HTML in WordPress posts/pages. But there is a large set of community contributed plugins to WordPress that help with this, including a couple that apparently work with Plotly.

  • wp-plotly designed to embed a Plotly hosted graph by providing the plotly URL. Doesn’t appear to work with the latest version of WordPress. No go
  • Plot.wp provides a WordPress shortcode for Plotly (plotly and /plotly with square brackets) into which you place Plotly json data and hey presto graph. Has a github repo and actually works with the latest version of WordPress.

How to produce JSON from Python

I’m a Python newbie. Don’t really grok it the way I did Perl. I assumed it should be possible to auto-generate the json from the Python code, but how.

Looks like this will work in a notebook, though it does appear to need the resulting single quotes converted into double quotes and two sets of double quotes removed to be acceptable JSON.

#.. Python code to produce plotly figure ready to be plotted
import json
jsonData['data'] = json.dumps( fig['data'])
jsonData['layout'] = json.dumps( fig['layout'])
jsonData

For the graph I’m currently playing with, this ends up with

{"layout": {"yaxis": {"range": [0, 100], "title": "% response rate"}, "title": "EDC3100 Semester 2 MyOpinion % Response Rate", "xaxis": {"ticktext": ["2014 (n=106)", "2015 (n=88)nLeaderboard", "2016 (n=100)nLeaderboard"], "title": "Year", "tickvals": ["2014", "2015", "2016"]}}, 
  "data": [{"type": "bar", "name": "EDC3100", "x": ["2014", "2015", "2016"], "y": [34, 48, 49]}, {"type": "scatter", "name": "USQ average", "x": ["2015", "2016"], "y": [26.83, 23.52]}]}

And the matching graph produced by plotly follows. Roll over the graph to see some “tooltips”.

References

Hannon, J. (2013). Incommensurate practices: sociomaterial entanglements of learning technology implementation. Journal of Computer Assisted Learning, 29(2), 168–178. https://doi.org/10.1111/j.1365-2729.2012.00480.x

Learning analytics should not promote one size fits all: The effects of instructional conditions in predicting academic success

What follows is a summary of

Gašević, D., Dawson, S., Rogers, T., & Gasevic, D. (2015). Learning analytics should not promote one size fits all: The effects of instructional conditions in predicating learning success. The Internet and Higher Education, 28, 68–84. doi:doi:10.1016/j.iheduc.2015.10.002

I’ve skimmed it before, but renewed interest is being driven by a local project to explore what analytics might reveal about 9 teacher education courses, especially in light of the QILT process and data.

Reactions

Good paper.

Connections to the work we’re doing in terms of similar number of courses (9) and a focus on looking into the diversity hidden by aggregated and homogenised data analysis. The differences are

  • we’re looking at the question of engagement, not prediction (necessarily);
  • we’re looking for differences within a single discipline/program and aiming to explore diversity within/across a program
  • in particular, what it might reveal about our assumptions and practices
  • some of our offering are online only

Summary

Gašević, et al (2015) looks at the influence of specific instructional conditions in 9 blended courses on success prediction using learning analytics and log-data.

A lack of attention to instructional conditions can lead to an over or under estimation of the effects of LMS features on students’ academic success

Learning analytics

Interest in, but questions around the portability of learning analytics.

the paper aims to empirically demonstrate the importance for understanding the course and disciplinary context as an essential step when developing and interpreting predictive models of academic success and attrition (Lockyer, Heathcote, & Dawson, 2013)

Some aims to decontextualise – i.e. that some work aims to identify predictive models that can

inform a generalized model of predictive risk that acts independently of contextual factors such as institution, discipline, or learning design. These omissions of contextual variables are also occasionally expressed as an overt objective.

While there are some large scale projects, most are small scale and (emphasis added)

small sample sizes and disciplinary homogeneity adds further complexity in interpreting the research findings, leaving open the possibility that disciplinary context and course specific effects may be contributing factors

 Absence of theory in learning analytics – at least until recently.  Theory that points to the influence of diversity in context, subject, teacher, and learner.

Most post-behaviorist learning theories would suggest the importance of elements of the specific learning situation and student and teacher intentions

Impact of context – Mentions Finnegan, Morris and Lee (2009) as a study that looked at the role of contextual variables and finding disciplinary differences and “no single significant predictor shared across all three disciplines”

Role of theoretical frameworks – argument for benefits of integrating theory

  • connect with prior research;
  • make clear the aim of research designs and thus what outcomes mean.

Theoretical grounding for study

Winne and Hadwin’s “constructivist, meta-cognitive approach to self-regulated learning

  1. learners construct their knowledge by using tools (cognitive, physical, and digital);
  2. to operate on raw information (stuff given by courses);
  3. to construct products of their learning;
  4. learning products are evaluated via internal and external standards
  5. learners make decisions about their the tactics and standards used.
  6. decisions are influenced by internal and external conditions

Leading to the idea proposition

that learning analytics must account for conditions in order to make any meaningful interpretation of learning success prediction

The focus here is on instructional conditions.

Predictions from this

  1. Students will tend to interact more with recommended tools
  2. There will be a positive relationship between students level of interaction and the instructional conditions of the course (high frequency of use tools will have a large impact on success)
  3. The central tendency will prevail so that models that aggregate variables about student interaction may lead to over/under estimation

Method

Correlational (non-experimental) design. 9 first year courses that were part of an institutional project on retention. Participation in that project based on a discipline specific low level of retention – a quite low 20% (at least to me).  4134 students from 9 courses over 5 years – not big numbers.

Outcome variables – percent mark and academic status – pass, fail, or withdrawn (n=88).

Data based on other studies and availability

  • Student characteristics: age, gender, international student, language at home, home remoteness, term access, previous enrolment, course start.
  • LMS trace data: usage of various tools, some continuous, some lesser used as dichotomous and then categorical variables (reasons given)

Various statistics tests and models used.

Discussion

Usage across courses was variable hence the advice (p. 79)

  1. there is a need to create models for academic success prediction for individual courses, incorporating instructional conditions into the analysis model.
  2. there must be careful consideration in any interpretation of any predictive model of academic success, if these models do not incorporate instructional conditions
  3. particular courses,which may have similar technology use,maywarrant separatemodels for academic suc- cess prediction due to the individual differences in the enrolled student cohort.

And

we draw two important conclusions: a) generalized models of academic success prediction can overestimate or underestimate effects of individual predictors derived from trace data; and b) use of a specific LMS feature by the students within a course does not necessarily mean that the feature would have a significant effect on the students’ academic success; rather, instructional conditions need to be considered in order to understand if, and why, some variables were significant in order to inform the research and practice of learning and teaching (pp. 79, 81)

Closes out with some good comments on moving students/teachers beyond passive consumers of these models and the danger of existing institutional practice around analytics having decisions be made too far removed from the teaching context.


Helping teachers "know thy students"

The first key takeaway from Motz, Teague and Shepard (2015) is

Learner-centered approaches to higher education require that instructors have insight into their students’ characteristics, but instructors often prepare their courses long before they have an opportunity to meet the students.

The following illustrates one of the problems teaching staff (at least in my institution) face when trying to “know thy student”. It ponders if learner experience design (LX design) plus learning analytics (LA) might help. Shows off one example of what I’m currently doing to fix this problem and ponders some future directions for development.

The problem

One of the problems I identified in this talk was what it took for me to “know thy student” during semester. For example, the following is a question asked by a student on my course website earlier this year (in an offering that included 300+ students).

Question on a forum

To answer this question, it would be useful “know thy student” in the following terms

  1. Where is the student located?
    My students are distributed throughout Australian and the world. For this assignment they should be using curriculum documents specific to their location. It’s useful to know if the student is using the correct curriculum documents.
  2. What specialisation is the student working on?
    As a core course the Bachelor of Education degree, my course includes all types of pre-service teachers. Ranging from students studying to be Early Childhood teachers, Primary school teachers, Secondary teachers, and even some looking to be VET teachers/trainers.
  3. What activities and resources has the student engaged with on the course site?
    The activities and resources on the site are designed to help students learn. There is an activity focused on this question, has this student completed it? When did they complete it?
  4. What else has the student written and asked about?
    In this course, students are asked to maintain their own blog for reflection. What the student has written on that blog might help provide more insight. Ditto for other forum posts.

To “know thy student” in the terms outlined above and limited to the tools provided by my institution requires:

  • the use three different systems;
  • use of a number of different reports/services within those two systems; and,
  • at least 10 minutes to click through each of these.
Norman on affordances

Given Norman’s (1993) observations is it any wonder that perhaps I might not spend 10 minutes on that task every time I respond to a question from the 300+ students?

Can learner experience (LX) design help?

Yesterday, Joyce (@catspyjamasnz) and I spent some time exploring if and how learner experience design (Joyce’s expertise) and learning analytics (my interest) might be combined.

As I’m currently working on a proposal to help make it easier for teachers “know thy students” this was uppermost in my mind. And, as Joyce pointed out, “know the students” is a key step in LX design. And, as Motz et al (2015) illustrate there appears to be some value in using learning analytics to help teachers “know thy students”. And, beyond Motz’s et al (2015) focus on planning, learning analytics has been suggested to help with the orchestration of learning in the form of process analytics (Lockyer et al, 2013). A link I was thinking about before our talk.

Out of all this a few questions

  1. Can LX design practices be married with learning analytics in ways that enhance and transform the approach used by Motz et al (2015)?
  2. Learning analytics can be critiqued as being driven more by the available data and the algorithms available to analyse it (the expertise of the “data scientists”) driving it. Some LA work is driven by educational theories/ideas. Does LX design offer a different set of “purposes” to inform the development of LA applications?
  3. Can LX design practices + learning analytics be used to translate what Motz et al (2015) see as “relatively rare and special” into more common practice

    Exceptionally thoughtful, reflective instructors do exist, who customize and adapt their course after the start of the semester, but it’s our experience that these instructors are relatively rare and special, and these efforts at learning about students requires substantial time investment.

  4. Can this type of practice be done in a way that doesn’t require “data analysts responsible for developing and distributing” (Motz et al, 2015) the information?
  5. What type of affordances can and should such an approach provide?
  6. What ethical/privacy issues would need to be addressed?
  7. What additional data should be gathered and how?

    e.g. in the past I’ve used the course barometer idea to gather student experience during a course. Might something like this be added usefully?

More student details

“More student details” is the kludge that I’ve put in place to solve the problem at the top of this post. I couldn’t live with the current systems and had to scratch that itch.

The technical implementation of this scratch involves

  1. Extracting data from various institutional systems via manually produced reports and screen scraping and placing that data into a database on my laptop.
  2. Adapting the MAV architecture to create a Greasemonkey script that talks to a server on my laptop that in turn extracts data from the database.
  3. Install the Greasemonkey script on the browser I use on my laptop.

As a result, when I use that browser to view the forum post at the top of this post, I actually see the following (click on the image to see a larger version). The red arrows have been added to the image to highlight what’s changed. The addition of [details] links.

Forum post + more student details

Whenever the Greasemonkey script sees a Moodle user profile link, it adds a [details] link. Regardless of which page on my Moodle course sites I’m on. The following image shows an excerpt from the results page for a Quiz. It has the [details] links as well.

Quiz results + more student details

It’s not beautiful, but it’s only something I currently use and I was after utility.

Clicking on the [details] links results in a popup window appearing. A window that helps me “know they student”. The window has three tabs. The first is labelled “Personal Details” and is visible below. It provides information from the institutional student records system, including name, email address, age, specialisation, which campus or mode the student is enrolled in, the number of prior units they’ve completed, their GPA, and their location and phone numbers.

Student background

The second tab on “more student details” shows details of the student’s activity completion. This is a Moodle idea where it tracks if and when a student has completed an activity or resource. My course site is designed as a collection of weekly “learning
paths”. Each path is a series of activities and resources design to help the student learn. Each week belongs to one of three modules.

The following image shows part of the “Activity Completion” tab for “more student details”. It shows that Module 2 starts with week 4 (Effective planning: a first step) and week 5 (Developing your learning plan). Each week has a series of activities and resources.

For each activity the student has completed, it shows when they completed that activity. This student completed the “Welcome to Module 2” – 2 months ago. If I hold the mouse over “2 months ago” it will display the exact time and date it was completed.

I did mention above that it’s useful, rather the beautiful.

Student activity completion

The “blog posts tab shows details about all the posts the student has written on their blog for this course. Each of the blog posts include a link to that blog post and shows how long ago the post was made.

Student blog posts

With this tool available, when I answer a question on a discussion forum I can quickly refresh what I know about the student and their progress before answering. When I consider a request for an assignment extension, I can check on the student’s progress so far. Without spending 10+ minutes doing so.

API implementation and flexibility

As currently implemented, this tool relies on a number of manual steps and my personal technology infrastructure. To scale this approach will require addressing these problems.

The traditional approach to doing this might involve making modifications to Moodle to add this functionality into Moodle. I think this is the wrong way to do it. It’s too heavyweight, largely because Moodle is a complex bit of software used by huge numbers of people across the world, and because most of the really useful information here is going to be unique to different courses. For example, not many courses at my institution currently use activity completion in the way my course does. Almost none of the courses at my institution use BIM and student blogs the way my course does. Beyond this, the type of information required to “know thy student” extends beyond what is available in Moodle.

To “know thy student”, especially when thinking of process analytics that are unique to the specific learning design used, it will be important that any solution be flexible. It should allow individual courses to adapt and modify the data required to fit the specifics of the course and its learning design.

Which is why I plan to continue the use of augmented browsing as the primary mechanism, and why I’ve started exploring Moodle’s API. It appears to provide a way to allow the development of a flexible and customisable approach to allowing “know thy student” respond to the full diversity of learning and teaching.

Now, I wonder how LX design might help?

What might a project combining LX Design and Analaytics look like?

In a bit more than an hour I’ll be talking to @catspyjamasnz trying to nut out some ideas for a project around LX Design and Learning Analytics. The following is me thinking out loud and working through “my issues”.

What is LX Design

I’ve got some vague ideas which I need to work on. Obviously start with a Google search.

Oh dear, the top result is for Learning Experience Design TRADEMARK which is apparently

a synthesis of instructional design, educational pedagogy, neuroscience, social sciences, design thinking, and UI/UX—is critical for any organization looking to compete in the modern educational marketplace.

While I won’t dwell on this particular approach, it does link to some of my vague qualms about LX design. First, there’s a danger of it becoming too much of another collection of meaningless buzzwords used to label the same old practice as conforming to the latest buzzwords. Mainly because the people adopting don’t fully understand it and fail transform their practice. Old wine, new bottles.

Second, there’s the problem of the “product focus” in learning. Where the focus is on building the best product, which troubles me. Perhaps this says more about my biases, but I worry that LX Design will become just another tool (perhaps a very good tool) applied within the dominant SET mindset within institutional e-learning (which is my context). Which not surprisingly is one of my concerns about the direction of learning analytics.

And talking about old wine in new bottles, this post suggests that

Although LXD is a relatively new term in the field of design, there are some established best practices emerging as applied to creating online learning interfaces:

Mmm, not much there that I’d class as something that LXD has provided to the world. e.g. Donald Clark’s current sequence of “10” posts, including “10 essential rules on use of GRAPHICS in online learning”.

Needs and wants of the user?

This overview of User Experience Design (UX Design) – the foundation on which LX design is built – suggests

The term “user experience” was coined by Dr. Donald Norman, a cognitive science researcher who was also the first to describe the importance of user-centered design (the notion that design decisions should be based on the needs and wants of users).

As I wrote last week I’m not convinced that the “needs and wants of users” is always the best approach. Especially if we’re talking about something very new that the user doesn’t yet understand.

Which begs the question:

Who is the user in a learning experience?

The obvious answer from a LX design perspective is that the user is the learner. That the focus should be on the learner has been the broadly accepted in higher education for some time now. But then all models are wrong, but some are useful. In critiquing the raise of the term Technology Enhanced Learning, Bayne (2014) draws on a range of publications by Biesta to critique the focus on learning and learners. I’ve just skimmed this argument for this post, but there is potentially something interesting and useful here.

Beyond this more theoretical question about the value of a “learner focus”, I’d also like to mention something a little closer to home. The context in which I’m framing this post is within higher education’s practice of formal learning. A practice that currently still assumes that there is some value in having a teacher involved in the learning experience. Where “teacher” may not be a single individual, but actually be a small team with diverse roles. Which leads me to the proposition that the “teacher” is also a user within a learning experience.

As I’m employed as a teacher within higher education, I can speak to the negative impact of the blindingly obvious, almost complete lack of user experience design around the tools and systems teachers are required to engage with around learning and teaching. Given the low quality of those tools, it’s no surprise to me that most learning in higher education has some flaws.

This is one of the reasons behind the 4 paths for learning analytics focusing on the teacher (as designer of learning, if you must) and not the learner.

Increasingly, I wonder if the focus on being learner centered is arising from a frustration with the perceived lack of quality of the learning experiences produced by teachers combined with a deficit model of teachers. Which brings me to this quote from Bayne (2014)

points us toward a need to move beyond anthropocentrism and the focus on the individual, toward a greater concern with the networks, ecologies and sociomaterial contexts of our engagement with education and technology.

Impact of LX design for teachers?

What would happen to the quality of learning overall, if LX design were applied to the systems and processes that teachers use to design, implement, support, and revise learning and teaching? Would this help teachers learn more about how to teach better?

Learning analytics

I assume the link between LX design and learning analytics is that learning analytics can provide the data to better inform LX design. In particular, what Lockyer et al (2013) call “process analytics” would be useful

These data and analyses provide direct insight into learner information processing and knowledge application (Elias, 2011) within the tasks that the student completes as part of a learning design. (p. 1448)

One of the problems @beerc and I have with learning analytics is that it really only ever focuses on two bits of the PIRAC framework i.e. information and representation. It hardly ever does anything about affordances or change. This is why dashboards suck and are a broken metaphor. A dashboard without the ability to do anything to control the car are no value whatsoever.

My questions about LXD

  1. Just another FAD? Old wine in new bottles?
  2. Another tool reinforcing the SET mindset? Especially the product focus.
  3. Does LX design have a problem because it doesn’t include complex adaptive systems theory? It appears to treat learner experience design as a complicated problem, rather than a complex problem.
  4. The “meta-learning” problem – can it be applied to teachers learning how to teach?
  5. Where does it fit on the spectrum of: sage on the stage, guide on the side, and meddler in the middle?
  6. How to make it useful for the majority of teachers and learners?
  7. What type of affordances can/should analytics provide LX design to help all involved?

References

Bayne, S. (2014). What’s the matter with Techology Enhanced Learning? Learning, Media & Technology, 40(1), 5–20. doi:10.1080/17439884.2014.915851.Available

Dashboards suck: learning analytics' broken metaphor

I started playing around with what became learning analytics in 2007 or so. Since then every/any time “learning analytics” is mentioned in a university there’s almost an automatic mention of dashboards. So much so I was lead to tweet.

I’ve always thought dashboards suck. This morning when preparing the slides for this talk on learning analytics I came across an explanation which I think captures my discomfort around dashboards (I do wonder whether I’d heard it somewhere else previously).

What is a dashboard

In the context of an Australian university discussion about learning analytics the phrase “dashboard” is typically mentioned by the folk from the business intelligence unit. The folk responsible for the organisational data warehouse. It might also get a mention from the web guru who’s keen on Google Analytics. In this context a dashboard is typically a collection of colourful charts, often even doing a good job of representing important information.

So what’s not to like?

The broken metaphor

Obviously “analytics” dashboards are a metaphor referencing the type of dashboard we’re familiar with in cars. The problem is that many (most?) of the learning analytics dashboards are conceptualised and designed like the following dashboard.

The problem is that this conceptualisation of dashboards misses the bigger picture. Rather than being thought of like the above dashboard, learning analytics dashboards need to be thought of as like the following dashboard.

Do you see the difference? (and it’s not the ugly, primitive nature of the graphical representation in the second dashboard).

Representation without Affordances and removed from the action

The second dashboard image includes: the accelerator, brake, and clutch pedals; the steering wheel; the indicators; the radio; air conditioning; and all of the other interface elements a driver requires to do something with the information presented in the dashboard. All of the affordances a driver requires to drive a car.

The first dashboard image – like many learning analytics dashboards – provides no affordances for action. The first vision of a dashboard doesn’t actually help you do anything.

What’s worse, the dashboards provided by most data warehouses aren’t even located within the learning environment. You have to enter into another system entirely, find the dashboard, interpret the information presented, translate that into some potential actions, exit the data warehouse, return to the learning environment, translate those potential actions into the affordances of the learning environment.

Picking up on the argument of Don Norman (see quote in image below), the difficulty of this process would seem likely to reduce the chances of any of those potential actions being taken. Especially if we’re talking about (casual) teaching staff working within a large course with limited training, support and tools.

Norman on affordances

Affordances improve learning analytics

Hence, my argument is that the dashboard (Representation) isn’t sufficient. In designing your learning analytics application you need to include the pedals, steering wheel etc (Affordances) if you want to increase the likelihood of that application actually helping improve the quality of learning and teaching. Which tends to suggest that your learning analytics application should be integrated into the learning environment.

Revisiting the IRAC framework and looking for insights

The Moodlemoot’AU 2015 conference is running working groups one of which is looking at assessment analytics. In essence, trying to think about what can be done in the Moodle LMS code to enhance assessment.

As it happens I’m giving a talk during the Moot titled “Four paths for learning analytics: Moving beyond a management fashion”. The aim of the talk is to provide some insights to help people think about the design and evaluation of learning analytics. The working seems like a good opportunity to (at some level) “eat my own dogfood” and fits with my current task of developing the presentation.

As part of getting ready for the presentation, I need to revisit the IRAC framework. A bit of work from 2013 that we’ve neglected, but which (I’m surprised and happy to say) I think holds much more promise than I may have thought. The following explains IRAC and what insights might be drawn from it. A subsequent post will hopefully apply this more directly to the task of Moodle assessment analytics.

(Yes, Col and Damien, I have decided once again to drop the P and stick with IRAC).

The IRAC Framework

Originally developed to “improve the analysis and design of learning analytics tools and interventions” and hopefully be “a tool to aid the mindful implementation of learning analytics” (Jones, Beer, Clark, 2013). The development of the framework drew upon “bodies of literature including Electronic Performance Support Systems (EPSS) (Gery, 1991), the design of cognitive artefacts (Norman, 1993), and Decision Support Systems (Arnott & Pervan, 2005).

This was largely driven by our observation that most of the learning analytics stuff wasn’t that much focused on whether or not it was actually adopted and used, especially by teachers. The EPSS literature was important because an EPSS is meant to embody a “perspective on designing systems that support learning and/or performing” (Hannafin, McCarthy, Hannafin, & Radtke, 2001, p. 658). EPSS are computer-based systems intended to “provide workers with the help they need to perform certain job tasks, at the time they need that help, and in a form that will be most helpful” (Reiser, 2001, p. 63).

Framework is probably not the right label.

IRAC was conceptualised as four questions to ask yourself about the learning analytics tool you were designing or evaluating. As outlined in Jones et al (2013)

The IRAC framework is intended to be applied with a particular context and a particular task in mind. A nuanced appreciation of context is at the heart of mindful innovation with Information Technology (Swanson & Ramiller, 2004). Olmos & Corrin (2012), amongst others, reinforce the importance for learning analytics to start with “a clear understanding of the questions to be answered” (p. 47) or the task to be achieved.

Once you’ve got your particular context and task in mind, then you can start thinking about these four questions:

  1. Is all the relevant Information and only the relevant information available?
  2. How does the Representation of the information aid the task being undertaken?
  3. What Affordances for interventions based on the information are provided?
  4. How will and who can Change the information, representation and the affordances?

Interestingly, not long after we’d submitted the paper for reviewing, Siemens (2013) came out and that paper included the following Learning Analytics (LA) Model (LAM) (click on the image to see a larger version). LAM was meant to help move LA from small scale “bottom-up” approaches into a more systemic and institutional approach. The “data team” was given significant emphasis in this.

Siemens (2013) Learning Analytics Model

Hopefully you can see how the Siemens’ LAM and the IRAC framework, at least on the surface, seem to cover much of the same ground. In case you can’t, the following image (click on it to see a larger version) makes that connection explicit.

IRAC and LAM

Gathering insights from IRAC and LAM

The abstract for the Moot presentation promises insights so let’s see what insights you might gain from IRAC. The following is an initial list of potential insights. Insights might be too strong a word. Provocations or hypothesis might be better suited.

  1. An over emphasis on Information.

    When overlaying IRAC onto the LAM the most obvious point for me is the large amount of space in the LAM dedicated to Information. This very large focus on the collection, acquisition, storage, cleaning, integration, and analysis of information is not all that surprising. After all that is what big data and analytics bring to the table. The people who developed the field of learning analytics came to it with an interest in information and its analysis. It’s important stuff. But it’s not sufficient to achieve the ultimate goal of learning analytics, which is captured in the following broadly used definition (emphasis added)

    Learning analytics is the measurement, collection, analysis and reporting of data about learners and their contexts, for purposes of understanding and optimising learning, and the environments in which it occurs.

    The point of learning analytics is to find out more about learning and the learning environment and change it for the better. That requires action. Action on part of the learner, the teacher, or perhaps the institution or other actors. There’s a long list of literature that strongly argues that simply providing information to people is not sufficient for action.

  2. Most of the information currently available is of limited value.

    In not a few cases, “big data is driven more by storage capabilities than by superior ways to ascertain useful knowledge” (Bollier & Firestone, 2012, p. 14). There have been questions asked about how much the information that is currently captured by LMSes and other systems can actually “contribute to the understanding of student learning in a complex social context such as higher education” (Lodge & Lewis, 2012, p. 563). Click streams reveal a lot about when and how people traverse e-learning environments, but not why and with what impacts. Beyond that is the problem raised by observations that the use of e-learning by most courses does not make particularly heavy or well-designed use of the learning environment.

  3. Don’t stop at a dashboard (Representation).

    It appears that most people think that if you’ve generated a report or (perhaps worse) a dashboard you have done your job when it comes to learning analytics. This fails on two parts.

    First, these are bad representations. Reports and many dashboards are often pretty crappy at helping people understand what is going on. Worse, these are typically presented outside of the space where the action happens. Breaking the goal of an an information system/EPSS i.e. “provide workers with the help they need to perform certain job tasks, at the time they need that help, and in a form that will be most helpful” (Reiser, 2001, p. 63).

    Second, just providing data in a pretty form is not sufficient. You want people to do something with the information. Otherwise, what’s the point? That’s why you have to consider the affordances question.

  4. Change is never considered.

    At the moment, most “learning analytics” projects involve installing a system, be it stand alone or part of the LMS etc. Once it’s installed it’s all just a better of ensuring people are using it. There’s actually no capacity to change the system or the answers to the I, R, or A questions of IRAC that the system provides. This is a problem on so many levels.

    In the original IRAC paper we mentioned: how development through continuous action cycles involving significant user participation was a core of the theory of decision support systems (Arnott & Pervan, 2005) a pre-cusor to learning analytics; Buckingham-Shum’s (2012) observation that most LA is based on data already being captured by systems and that analysis of that data will perpetuate existing dominant approaches to learning; the problem of gaming once people learn what the system wants. Later we added the task artifact cycle.

    More recently (Macfadyen et al 2014) argue that one of the requirements of learning analytics tools is an integrated and sustained overall refinement procedure allowing reflection” (p. 12).

  5. The more context sensitive the LA is, the more value it has.

    In talking about the use of the SNAPP tool to visualise connections in discussion forums, Lockyer et al (2013) explain that the “interpretation of visualizations also depends heavily on an understanding the context in which the data were collected and the goals of the teacher regarding in-class interaction” (p. 1446). The more you know about the learning context, the better the insight you can draw from learning analytics. An observation that brings the reusability paradox into the picture. Most LA – especially those designed into an LMS – have to be designed to have the potential to be reused across all of the types of institutions that use the LMS. This removes the LMS (and its learning analytics) away from the specifics of the context, which reduces its pedagogical value.

  6. Think hard about providing and enhancing affordances for intervention

    Underpinning the IRAC work is the work of Don Norman (1993), in particular the quote in the image of him below. If LA is all about optimising learning and the learning environment then the LA application has to make it easy for people to engage in activities designed to bring that goal about. If it’s hard, they won’t do it. Meaning all that wonderfully complex algorithmic magic is wasted.

    Macfadyen et al (2014) identify facilitating the deployment of interventions that lead to change to enhance learning as a requirement of learning analytics. Wise (2014) defines learning analytics intervention “as the surrounding frame of activity through which analytics tools, data and reports are taken up and used”. An area of learning analytics that is relatively unexplored (Wise, 2014) and I’ll close with another quote from Wise (2014) which sums up the whole point of the IRAC framework and identifies what I think is the really challenging problem for LA

    If learning analytics are to truly make an impact on teaching and learning and fulfill expectations of revolutionizing education, we need to consider and design for ways in which they will impact the larger activity patterns of instructors and students. (Wise, 2014, 203)

    (and I really do need to revisit the Wise paper).

Norman on affordances

References

Arnott, D., & Pervan, G. (2005). A critical analysis of decision support systems research. Journal of Information Technology, 20(2), 67–87. doi:10.1057/palgrave.jit.2000035

Bollier, D., & Firestone, C. (2010). The promise and peril of big data. Washington DC: The Aspen Institute. Retrieved from http://india.emc.com/collateral/analyst-reports/10334-ar-promise-peril-of-big-data.pdf

Buckingham Shum, S. (2012). Learning Analytics. Moscow. Retrieved from http://iite.unesco.org/pics/publications/en/files/3214711.pdf

Hannafin, M., McCarthy, J., Hannafin, K., & Radtke, P. (2001). Scaffolding performance in EPSSs: Bridging theory and practice. In World Conference on Educational Multimedia, Hypermedia and Telecommunications (pp. 658–663). Retrieved from http://www.editlib.org/INDEX.CFM?fuseaction=Reader.ViewAbstract&paper_id=8792

Gery, G. J. (1991). Electronic Performance Support Systems: How and why to remake the workplace through the strategic adoption of technology. Tolland, MA: Gery Performance Press.

Jones, D., Beer, C., & Clark, D. (2013). The IRAC framwork: Locating the performance zone for learning analytics. In H. Carter, M. Gosper, & J. Hedberg (Eds.), Electric Dreams. Proceedings ascilite 2013 (pp. 446–450). Sydney, Australia.

Lockyer, L., Heathcote, E., & Dawson, S. (2013). Informing Pedagogical Action: Aligning Learning Analytics With Learning Design. American Behavioral Scientist, 57(10), 1439–1459. doi:10.1177/0002764213479367

Lodge, J., & Lewis, M. (2012). Pigeon pecks and mouse clicks : Putting the learning back into learning analytics. In M. Brown, M. Hartnett, & T. Stewart (Eds.), Future challenges, sustainable futures. Proceedings ascilite Wellington 2012 (pp. 560–564). Wellington, NZ. Retrieved from http://www.ascilite2012.org/images/custom/lodge,_jason_-_pigeon_pecks.pdf

Macfadyen, L. P., Dawson, S., Pardo, A., & Gasevic, D. (2014). Embracing big data in complex educational systems: The learning analytics imperative and the policy challenge. Research and Practice in Assessment, 9(Winter), 17–28.

Norman, D. A. (1993). Things that make us smart: defending human attributes in the age of the machine. Cambridge, Mass: Perseus. Reading, MA: Addison Wesley.

Olmos, M., & Corrin, L. (2012). Learning analytics: a case study of the process of design of visualizations. Journal of Asynchronous Learning Networks, 16(3), 39–49. Retrieved from http://ro.uow.edu.au/medpapers/432/

Reiser, R. (2001). A history of instructional design and technology: Part II: A history of instructional design. Educational Technology Research and Development, 49(2), 57–67.

Siemens, G. (2013). Learning Analytics: The Emergence of a Discipline. American Behavioral Scientist, 57(10), 1371–1379. doi:10.1177/0002764213498851

Swanson, E. B., & Ramiller, N. C. (2004). Innovating mindfully with information technology. MIS Quarterly, 28(4), 553–583.

Wise, A. F. (2014). Designing pedagogical interventions to support student use of learning analytics. In Proceedins of the Fourth International Conference on Learning Analytics And Knowledge – LAK ’14 (pp. 203–211). doi:10.1145/2567574.2567588

Reading – Embracing Big Data in Complex Educational Systems: The Learning Analytics Imperative and the Policy Challenge

The following is a summary and ad hoc thoughts on Macfadyen et al (2014).

There’s much to like in the paper. But the basic premise I see in the paper is that to fix the problems of the current inappropriate teleological processes used in institutional strategic planning and policy setting is an enhanced/adaptive teleological process. The impression I take from the paper is that it’s still missing the need for institutional to be enabling actors within institutions to integrate greater use of ateleological processes (see Clegg, 2002). Of course, Clegg goes onto do the obvious and develop a “dialectical approach to strategy” that merges the two extremes.

Is my characterisation of the adaptive models presented here appropriate?

I can see very strong connections with the arguments made in this paper between institutions and learning analytics and the reasons why I think e-learning is a bit like teenage sex.

But given the problems with “e-learning” (i.e. most of it isn’t much good in pedagogical terms) what does that say about the claim that we’re in an age of “big data” in education. If the pedagogy of most e-learning is questionable, is the data being gathered any use?

Conflating “piecemeal” and “implementation of new tools”

The abstract argues that there must be a shift “from assessment-for-accountability to assessment-for-learning” and suggests that it won’t be achieved “through piecemeal implementation of new tools”.

It seems to me that this is conflating two separate ideas, they are

  1. piecemeal; and,

    i.e. unsystematic or partial measures. It can’t happen bit-by-bit, instead it has to proceed at the whole of institutional level. This is the necessary step in the argument that institutional change is (or must be) involved.

    One of the problems I have with this is that if you are thinking of educational institutionals as complex adaptive systems, then that means they are the type of system where a small (i.e. piecemeal change) could potentially (but not always) have a large impact. In a complex system, a few very small well directed changes may have a large impact. Or alternatively and picking up on ideas I’ve heard from Dave Snowden, implementing large amounts of very small projects and observing the outcomes may be the only effective way forward. By definition a complex system is one where being anything but piecemeal may be an exercise in futility. As you can never understand a complex system, let alone being able to guess the likely impacts of proposed changes..

    The paper argues that systems of any type are stable and resistant to change. There’s support for this argument. I need to look for dissenting voices and evaluate.

  2. implementation of new tools.

    i.e. the build it and they will come approach won’t work. Which I think is the real problem and is indicative of the sort of simplistic planning processes that the paper argues against.

These are two very different ideas. I’d also argue that while these alone won’t enable the change, they are both necessary for the change. I’d also argue that institutional change (by itself) is also unlikely to to achieve the type of cultural change required. The argument presented in seeking to explain “Why e-learning is a bit like teenage sex” is essentially this. That institutional attempts to enable and encourage changed in learning practice toward e-learning fail because they are too focused on institutional concerns (large scale strategic change) and not enough on enabling elements of piecemeal growth (i.e. bricolage).

The Reusability Paradox and “at scale”

I also wonder about considerations raised by the reusability paradox in connection with statements like (emphasis added) “learning analytics (LA) offer the possibility of implementing real–time assessment and feedback systems and processes at scale“. Can the “smart algorithms” of LA marry the opposite ends of the spectrum – pedagogical value and large scale reuse? Can the adaptive planning models bridge that gap?

Abstract

In the new era of big educational data, learning analytics (LA) offer the possibility of implementing real–time assessment and feedback systems and processes at scale that are focused on improvement of learning, development of self–regulated learning skills, and student success. How- ever, to realize this promise, the necessary shifts in the culture, techno- logical infrastructure, and teaching practices of higher education, from assessment–for–accountability to assessment–for–learning, cannot be achieved through piecemeal implementation of new tools. We propose here that the challenge of successful institutional change for learning analytics implementation is a wicked problem that calls for new adaptive forms of leadership, collaboration, policy development and strategic planning. Higher education institutions are best viewed as complex systems underpinned by policy, and we introduce two policy and planning frameworks developed for complex systems that may offer institutional teams practical guidance in their project of optimizing their educational systems with learning analytics.

Introduction

First para is a summary of all the arguments for learning analytics

  • awash in data (I’m questioning)
  • now have algorithms/methods that can extract useful stuff from the data
  • using these methods can help make sense of complex environments
  • education is increasingly complex – increasing learner diversity, reducing funding, increasing focus on quality and accountability, increasing competition
  • it’s no longer an option to use the data

It also includes a quote from a consulting company promoting FOMO/falling behind if you don’t use it. I wonder how many different fads they’ve said that about?

Second para explains what the article is about – “new adaptive policy and planning approaches….comprehensive development and implementation of policies to address LA challenges of learning design, leadership, institutional culture, data access and security, data privacy and ethical dilemmas, technology infrastructure, and a demonstrable gap in institutional LA skills and capacity”.

But based on the idea of Universities as complex adaptive systems. That “simplistic approaches to policy development are doomed to fail”.

Assessment practices: A wicked problem in a complex system

Assessment is important. Demonstrates impact – positive and negative – of policy. Assessment still seen too much as focused on accountability and not for learning. Diversity of stakeholders and concerns around assessment make substantial change hard.

“Assessment practice will continue to be intricately intertwined both with learning
and with program accreditation and accountability measures.” (p. 18). NCLB used as an example of the problems this creates and mentions Goodhart’s law.

Picks up the on-going focus on “high-stakes snapshot testing” to provide comparative data. Mentions

Wall, Hursh and Rodgers (2014) have argued, on the other hand, that the perception that students, parents and educational leaders can only obtain useful comparative information about learning from systematized assessment is a false one.

But also suggests that learning analytics may offer a better approach – citing (Wiliam, 2010).

Identifies the need to improve assessement practices at the course level. Various references.

Touches on the difficulties in making these changes. Mentions wicked problems and touches on complex systems

As with all complex systems, even a subtle change may be perceived as difficult, and be resisted (Head & Alford, 2013).

But doesn’t pick up the alternate possibility that a subtle change that might not be seen as difficult could have large ramifications.

Learning analytics and assessment-for-learning

This paper is part of a special issue on LA and assessment. Mentions other papers that have show the contribution LA can make to assessment.

Analytics can add distinct value to teaching and learning practice by providing greater insight into the student learning process to identify the impact of curriculum and learning strategies, while at the same time facilitating individual learner progress (p. 19)

The argument is that LA can help both assessment tasks: quality assurance, and learning improvement.

Technological components of the educational system and support of LA

The assumption is that there is a technological foundation for – storing, managing, visualising and processing big educational data. Need for more than just the LMS. Need to mix it all up and this “institutions are recognizing the need to re–assess the concept of teaching and learning space to encompass both physical and virtual locations, and adapt learning experiences to this new context (Thomas, 2010)” (p. 20) Add to that the rise of multiple devices etc.

Identifies the following requirements for LA tools (p. 21) – emphasis added

  1. Diverse and flexible data collection schemes: Tools need to adapt to increasing data sources, distributed in location, different in scope, and hosted in any platform.
  2. Simple connection with institutional objectives at different levels: information needs to be understood by stakeholders with no extra effort. Upper management needs insight connected with different organizational aspects than an educator. User–guided design is of the utmost importance in this area.
  3. Simple deployment of effective interventions, and an integrated and sustained overall refinement procedure allowing reflection

Some nice overlaps with the IRAC framework here.

It does raise interesting questions about what are institutional objectives? Even more importantly how easy it is or isn’t to identify what those are and what they mean at the various levels of the institution.

Interventions An inset talks about the sociotechnical infrastructure for LA. It mentions the requirement for interventions. (p. 21)

The third requirement for technology supporting learning analytics is that it can facilitate the deployment of so–called interventions, where intervention may mean any change or personalization introduced in the environment to support student success, and its relevance with respect to the context. This context may range from generic institutional policies, to pedagogical strategy in a course. Interventions at the level of institution have been already studied and deployed to address retention, attrition or graduation rate problems (Ferguson, 2012; Fritz, 2011; Tanes, Arnold, King, & Remnet, 2011). More comprehensive frameworks that widen the scope of interventions and adopt a more formal approach have been recently proposed, but much research is still needed in this area (Wise, 2014).

And then this (pp. 21-22) which contains numerous potential implications (emphasis added)

Educational institutions need technological solutions that are deployed in a context of continuous change, with an increasing variety of data sources, that convey the advantages in a simple way to stakeholders, and allow a connection with the underpinning pedagogical strategies.

But what happens when the pedagogical strategies are very, very limited?

Then makes this point as a segue into the next section (p. 22)

Foremost among these is the question of access to data, which needs must be widespread and open. Careful policy development is also necessary to ensure that assessment and analytics plans reflect the institution’s vision for teaching and strategic needs (and are not simply being embraced in a panic to be seen to be doing something with data), and that LA tools and approaches are embraced as a means of engaging stakeholders in discussion and facilitating change rather than as tools for measuring performance or the status quo.

The challenge: Bringing about institutional change in complex systems

“the real challenges of implementation are significant” (p. 22). The above identifies “only two of the several and interconnected socio-technical domains that need to be addressed by comprehensive institutional policy and strategic planning”

  1. influencing stakeholder understanding of assessment in education
  2. developing the necessary institutional technological infrastructure to support the undertaking

And this has to be done whilst attending to business as usual.

Hence not surprising that education lags other sectors in adoption analytics. Identifies barriers

  • lack of practical, technical and financial capacity to mind big data

    A statement from the consulting firm who also just happens to be in the market of selling services to help.

  • perceived need for expensive tools

Cites various studies showing education institutions stuck at gathering and basic reporting.

And of course even if you get it right…

There is recognition that even where technological competence and data exist, simple presentation of the facts (the potential power of analytics), no matter how accurate and authoritative, may not be enough to overcome institutional resistance (Macfadyen & Dawson, 2012; Young & Mendizabal, 2009).

Why policy matters for LA

Starts with establishing higher education institutions as a “superb example of complex adaptive systems” but then suggests that (p. 22)

policies are the critical driving forces that underpin complex and systemic institutional problems (Corvalán et al., 1999) and that shape perceptions of the nature of the problem(s) and acceptable solutions.

I struggle a bit with that observation and even more with this argument (p. 22)

we argue that it is therefore only through implementation of planning processes driven by new policies that institutional change can come about.

Expands on the notion of CAS and wicked problems. Makes this interesting point

Like all complex systems, educational systems are very stable, and resistant to change. They are resilient in the face of perturbation, and exist far from equilibrium, requiring a constant input of energy to maintain system organization (see Capra, 1996). As a result, and in spite of being organizations whose business is research and education, simple provision of new information to leaders and stakeholders is typically insufficient to bring about systemic institutional change.

Now talks about the problems more specific to LA and the “lack of data-driven mind-set” from senior management. Links this to earlier example of institutional research to inform institutional change (McINtosh, 1979) and links to a paper by Ferguson applying those findings to LA, from there and other places factors identified include

  • academics don’t want to act on findings from other disciplines;
  • disagreements over qualitative vs quantitative approaches;
  • researchers & decision makers speak different languages;
  • lack of familiarity with statistical methods
  • data not presented/explained to decision makers well enough.
  • researchers tend to hedge an dquality conclusions.
  • valorized education/faculty autonomy and resisted any administrative efforts perceived to interfere with T&L practice

Social marketing and change management is drawn upon to suggest that “social and cultural change” isn’t brought about by simply by giving access to data – “scientific analyses and technical rationality are insufficient mechanisms for understanding and solving complex problems” (p. 23). Returns to

what is needed are comprehensive policy and planning frameworks to address not simply the perceived shortfalls in technological tools and data management, but the cultural and capacity gaps that are the true strategic issues (Norris & Baer, 2013).

Policy and planning approaches for wicked problems in complex systems

Sets about defining policy. Includes this which resonates with me

Contemporary critics from the planning and design fields argue, however, that these classic, top–down, expert–driven (and mostly corporate) policy and planning models are based on a poor and homogenous representation of social systems mismatched with our contemporary pluralistic societies, and that implementation of such simplistic policy and planning models undermines chances of success (for review, see Head & Alford, 2013).

Draws on wicked problem literature to expand on this. Then onto systems theory.

And this is where the argument about piecemeal growth being insufficient arises (p. 24)

These observations not only illuminate why piecemeal attempts to effect change in educational systems are typically ineffective, but also explains why no one–size–fits–all prescriptive approach to policy and strategy development for educational change is available or even possible.

and perhaps more interestingly

Usable policy frameworks will not be those which offer a to do list of, for example, steps in learning analytics implementation. Instead, successful frameworks will be those which guide leaders and participants in exploring and understanding the structures and many interrelationships within their own complex system, and identifying points where intervention in their own system will be necessary in order to bring about change

One thought is whether or not this idea is a view that strikes “management” as “researchers hedging their bets”? Mentioned above as a problem above.

Moves onto talking “adaptive management strategies” (Head and Alford, 2013) which offer new means for policy and planning that “can allow institutions to respond flexibly to ever-changing social and institutional contexts and challenges” which talk about

  • role of cross-institutional collaboration
  • new forms of leadership
  • development of enabling structures and processes (budgeting, finance, HR etc)

Interesting that notions of technology don’t get a mention.

Two “sample policy and planning models” are discussed.

  1. Rapid Outcome Mapping Approach (ROMA) – from international development

    “focused on evidence-based policy change”. An iterative model. I wonder about this

    Importantly, the ROMA process begins with a systematic effort at mapping institutional context (for which these authors offer a range of tools and frameworks) – the people, political structures, policies, institutions and processes that may help or hinder change.

    Perhaps a step up, but isn’t this still big up front design? Assumes you can do this? But then some is better than none?

    Apparently this approach is used more in Ferguson et al (2014)

  2. “cause-effect framework” – DPSEEA framework

    Driving fource, Pressure, State, Exposure, Effect (DPSEEA) a way of identifying linkages between forces underpinning complex systems.

Ferguson et al (2014) apparently map “apparently successful institutional policy and planning processes have pursued change management approaches that map well to such frameworks”. So not yet informed by? Of course, there’s always the question of the people driving those systems reporting on their work?

I do like this quote (p. 25)

To paraphrase Head and Alford (2013), when it comes to wicked problems in complex systems, there is no one– size–fits–all policy solution, and there is no plan that is not provisional.

References

Ferguson, R., Clow, D., Macfadyen, L., Essa, A., Dawson, S., & Alexander, S. (2014). Setting Learning Analytics in Context : Overcoming the Barriers to Large-Scale Adoption. Journal of Learning Analytics, 1(3), 120–144. doi:10.1145/2567574.2567592

Macfadyen, L. P., Dawson, S., Pardo, A., & Gasevic, D. (2014). Embracing big data in complex educational systems: The learning analytics imperative and the policy challenge. Research and Practice in Assessment, 9(Winter), 17–28.

The four paths for implementing learning analytics and enhancing the quality of learning and teaching

The following is a place holder for two presentations that are related. They are:

  1. “Four paths for learning analytics: Moving beyond a management fashion”; and,

    An extension of Beer et al (2014) (e.g. there are four paths now, rather than three) that’s been accepted to Moodlemoot’AU 2015.

  2. “The four paths for implementing learning analytics and enhancing the quality of learning and teaching”;

    A USQ research seminar that is part a warm up of the Moot presentation, but also an early attempt to extend the 4 paths idea beyond learning analytics and into broader institutional attempts to improve learning and teaching.

Eventually the slides and other resources from the presentations will show up here. What follows is the abstract for the second talk.

Slides for the MootAU15 presentation

Only 15 minutes for this talk. Tried to distill the key messages. Thanks to @catspyjamasnz the talk was captured on Periscope

Slides for the USQ talk

Had the luxury of an hour for this talk. Perhaps to verbose.

Abstract

Baskerville and Myers (2009) define a management fashion as “a relatively transitory belief that a certain management technique leads rational management progress” (p. 647). Maddux and Cummings (2004) observe that “education has always been particularly susceptible to short-lived, fashionable movements that come suddenly into vogue, generate brief but intense enthusiasm and optimism, and fall quickly into disrepute and abandonment” (p. 511). Over recent years learning analytics has been looming as one of the more prominent fashionable movements in educational technology. Illustrated by the apparent engagement of every institution and vendor in some project badged with the label learning analytics. If these organisations hope to successfully harness learning analytics to address the challenges facing higher education, then it is important to move beyond the slavish adoption of the latest fashion and aim for more mindful innovation.

Building on an earlier paper (Beer, Tickner, & Jones, 2014) this session will provide a conceptual framework to aid in moving learning analytics projects beyond mere fashion. The session will identify, characterize, and explain the importance of four possible paths for learning analytics: “do it to” teachers; “do it for” teachers; “do it with” teachers; and, teachers “DIY”. Each path will be illustrated with concrete examples of learning analytics projects from a number of universities. Each of these example projects will be analysed using the IRAC framework (Jones, Beer, & Clark, 2013) and other lenses. That analysis will be used to identify the relative strengths, weaknesses, and requirements of each of the four paths. The analysis will also be used to derive implications for the decision-makers, developers, instructional designers, teachers, and other stakeholders involved in both learning analytics, and learning and teaching.

It will be argued that learning analytics projects that follow only one of the four paths are those most likely to be doomed to mere fashion. It will argue that moving a learning analytics project beyond mere fashion will require a much greater focus on the “do it with” and “DIY” paths. An observation that is particularly troubling when almost all organizational learning analytics projects appear focused primarily on either the “do it to” or “do it for” paths.

Lastly, the possibility of connections between this argument and the broader problem of enhancing the quality of learning and teaching will be explored. Which paths are used by institutional attempts to improve learning and teaching? Do the paths used by institutions inherently limit the amount and types of improvements that are possible? What implications might this have for both research and practice?

References

Baskerville, R. L., & Myers, M. D. (2009). Fashion waves in information systems research and practice. MIS Quarterly, 33(4), 647–662.

Beer, C., Tickner, R., & Jones, D. (2014). Three paths for learning analytics and beyond : moving from rhetoric to reality. In B. Hegarty, J. McDonald, & S. Loke (Eds.), Rhetoric and Reality: Critical perspectives on educational technology. Proceedings ascilite Dunedin 2014 (pp. 242–250).

Jones, D., Beer, C., & Clark, D. (2013). The IRAC framwork: Locating the performance zone for learning analytics. In H. Carter, M. Gosper, & J. Hedberg (Eds.), Electric Dreams. Proceedings ascilite 2013 (pp. 446–450). Sydney, Australia.

Maddux, C., & Cummings, R. (2004). Fad, fashion, and the weak role of theory and research in information technology in education. Journal of Technology and Teacher Education, 12(4), 511–533.

Learning analytics is better when…..?

Trying to capture some thinking that arose during an institutional meeting re: learning analytics. The meeting was somewhat positive, but – as is not uncommon – there seemed to be some limitations around what learning analytics actually is and what it might look like. Wondering if the following framing might help it draws on points made by numerous people about learning analytics and some strong echoes of the (P)IRAC framework

Learning analytics better when it

  1. knows more about the learning environment;
    (learning environment includes learners, teachers, learning designs etc.)
  2. is accessible from within the learning environment;
    i.e. learners and teachers don’t need to remove themselves from the learning environment to access the learning analytics.
  3. provides affordances for action within the learning environment;
    If no change results from the learning analytics, then there is little value in it.
  4. can be changed by people within the learning environment.
    i.e. learners and teachers (and perhaps others) can modify the learning analytics for their own (new) purposes.

The problem is that I don’t think that institutional considerations of learning analytics pay much atention to these four axes and this may explain limited usage and impact arising from the tools.

All four axes tend to require knowing a lot about the specifics of the learning environment and being able to respond to what you find in that environment in a contextually appropriate way.

The more learning analytics enables this, the more useful it is. The more useful it is, the more it used and the more impact it will have.

A few examples to illustrate.

Data warehouse

  1. What does it know about the learning environment? Limited
    Generally will know who the learners are, what they are studying, where they are from etc. May know what they have done within various institutional systems.
    Almost certainly knows nothing about the learning design.
    Probably knows who’s teaching what they’ve taught before.
  2. Accessible from the learning environment? Probably not
    Access it via a dashboard tool which is separate from the learning environment. i.e. not going to be emedded within the discussion forum tool, or the wiki tool.
    A knowledgeable user of the tool may well set up their own broader environment so that the data warehouse is integrated into it.
  3. Affordances for action? NONE
    It can display information, that’s it.
  4. Change? Difficult and typically the same for everyone
    Only the data warehouse people can change the representation of the information the warehouse provides. They probably can’t change the data that is included in the data warehouse without buy in from external system owners. IT governance structures need to be traversed.

Moodle reports

  1. What does it know about the learning environment? Limited
    Know what the students have done within Moodle. But does not typically know of anything outside Moodle.
  2. Accessible from the learning environment? Somewhat
    If you’re learning within Moodle, you can get to the Moodle reports. But the Moodle reports are a separate module (functionality) and thus aspects of the Moodle reports cannot be easily included into other parts of the Moodle learning environment and certainly cannot be integrated into non-Moodle parts of the learning environment.
  3. Affordances for action? Limited
    The closest is that some reports provide the ability to contact digitally students who meet certain criteria. However, the difficulty of using the reports suggests that the actual “affordances” are somewhat more limited.
  4. Change? Difficult, limited to Moodle
    Need to have some level of Moodle expertise and some greater level of access to modify reports. Typically would need to go through some level of governance structure. Probably can’t be change to access much outside of Moodle.

“MAV-enabled analytics”

A paper last year describes the development of MAV at CQU and some local tinkering I did using MAV i.e. “MAV-enabled analytics”.

  1. What does it know about the learning environment? Limited but growing
    As described, both MAV (student clicks on links in Moodle) and my tinkering (student records data) draw on low level information. In a month or so my on-going tinkering has the tool including information about student completion of activities in my course site and what the students have written on their individual blogs. Hopefully that will soon be extended with SNA and some sentiment analysis.
  2. Accessible from the learning environment? Yes
    Both are analytics tools are embedded into the Moodle LMS – the prime learning environment for this context.
  3. Affordances for action? Limited but growing
    My tinkering offers little. MAV @ CQU is integrated with other systems to support a range of actions associated with contacting and tracking students. Both systems are very easy to use, hence increasing the affordances.
  4. Change? Slightly better than limited.
    MAV has arisen from tinkering and thus new functionality can be added. However, it requires someone who knows how MAV and its children work. It can’t be changed by learners/teachers. However, as I am the teacher using the results of my tinkering, I can change it. However, I’m constrained by time and system access.

Using the PIRAC – Thinking about an "integrated dashboard"

On Monday I’m off to a rather large meeting to talk about what data might be usefully syndicated into a integrated dashboard. The following is an attempt to think out lod about the (P)IRAC framework (Jones, Beer and Clark, 2013) in the context of this local project. To help prepare me for the meeting, but also to ponder some recent thoughts about the framework.

This is still a work in progress.

Get the negativity out of the way first

Dashboards sux!!

I have a long-term negative view of the value of dashboards and traditional data warehouses/business intelligence type systems. A view that has risen out of both experience and research. For example, the following is a slide from this invited presentation. There’s also a a paper (Beer, Jones, & Tickner, 2014) that evolved from that presentation.

Slide19

I don’t have a problem with the technology. Data warehouse tools do have a range of functionality that is useful. However, in terms of providing something useful to the everyday life of teachers in a way that enhances learning and teaching, they leave a lot to be desired.

The first problem is the Law of Instrument.

Hammer ... Nail ... by Theen ..., on Flickr
Creative Commons Creative Commons Attribution-Noncommercial-Share Alike 2.0 Generic License   by  Theen … 

The only “analytics” tool the institution has is the data warehouse, so that’s what it has to use. The problem being is that the data warehouse cannot be easily and effectively integrated into the daily act of learning and teaching in a way that provides significant additional affordances (more on affordances below).

Hence it doesn’t get used.

Now, leaving that aside.

(P)IRAC

After a few years of doing learning analytics stuff, we put together the IRAC framework as an attempt to guide learning analytics projects. Broaden the outlook and what needed to be considered. Especially what needed to be considered to ensure that the project outcome was widely and effectively used. The idea is that the four elements of the framework could help ponder what was available and what might be required. The four original components of IRAC are summarised in the following table.

IRAC Framework (adapted from Jones et al 2013)
Component Description
Information
  • the information we collect is usually about “those things that are easiest to identify and count or measure” but which may have “little or no connection with those factors of greatest importance” (Norman, 1993, p. 13).
  • Verhulst’s observation (cited in Bollier & Firestone, 2010) that “big data is driven more by storage capabilities than by superior ways to ascertain useful knowledge” (p. 14).
  • Is the information required technically and ethically available for use?
  • How is the information to be cleaned, analysed and manipulated?
  • Is the information sufficient to fulfill the needs of the task?
  • In particular, does the information captured provide a reasonable basis upon which to “contribute to the understanding of student learning in a complex social context such as higher education” (Lodge & Lewis, 2012, p. 563)?
Representation
  • A bad representation will turn a problem into a reflective challenge, while an appropriate representation can transform the same problem into a simple, straightforward task (Norman, 1993).
  • To maintain performance, it is necessary for people to be “able to learn, use, and reference necessary information within a single context and without breaks in the natural flow of performing their jobs.” (Villachica et al., 2006, p. 540).
  • Olmos and Corrin (2012) suggest that there is a need to better understand how visualisations of complex information can be used to aid analysis.
  • Considerations here focus on how easy is it to understand the implications and limitations of the findings provided by learning analytics? (and much, much more)
Affordances
  • A poorly designed or constructed artefact can greatly hinder its use (Norman, 1993).
  • To have a positive impact on individual performance an IT tool must be utilised and be a good fit for the task it supports (Goodhue & Thompson, 1995).
  • Human beings tend to use objects in “ways suggested by the most salient perceived affordances, not in ways that are difficult to discover” (Norman, 1993, p. 106).
  • The nature of such affordances are not inherent to the artefact, but are instead co-determined by the properties of the artefact in relation to the properties of the individual, including the goals of that individual (Young, Barab, & Garrett, 2000).
  • Glassey (1998) observes that through the provision of “the wrong end-user tools and failing to engage and enable end users” even the best implemented data warehouses “sit abandoned” (p. 62).
  • The consideration for affordances is whether or not the tool and the surrounding environment provide support for action that is appropriate to the context, the individuals and the task.
Change
  • Evolutionary development has been central to the theory of decision support systems (DSS) since its inception in the early 1970s (Arnott & Pervan, 2005).
  • Rather than being implemented in linear or parallel, development occurs through continuous action cycles involving significant user participation (Arnott & Pervan, 2005).
  • Buckingham-Shum (2012) identifies the risk that research and development based on data already being gathered will tend to perpetuate the existing dominant approaches from which the data was generated.
  • Bollier and Firestone (2010) observe that once “people know there is an automated system in place, they may deliberately try to game it” (p. 6).
  • Universities are complex systems (Beer, Jones, & Clark, 2012) requiring reflective and adaptive approaches that seek to identify and respond to emergent behaviour in order to stimulate increased interaction and communication (Boustani et al., 2010).
  • Potential considerations here include, who is able to implement change? Which, if any, of the three prior questions can be changed? How radical can those changes be? Is a diversity of change possible?

Adding purpose

Whilst on holiday enjoying the Queenstown view below and various refreshments, @beerc and I discussed a range of issues, including the IRAC framework and what might be missing. Both @beerc and @damoclarky have identified potential elements to be added, but I’ve always been reluctant. However, one of the common themes underpinning much of the discussion of learning analytics at ASCILITE’2014 was for whom was learning analytics being done? We raised this question somewhat in our paper when we suggested that much of learning analytics (and educational technology) is mostly done to academics (and students). Typically in the service of some purpose serving the needs of senior management or central services. But the issue was also raised by many others.

Which got us thinking about Purpose.

Queenstown View

As originally framed (Jones et al, 2013)

The IRAC framework is intended to be applied with a particular context and a particular task in mind……Olmos & Corrin (2012), amongst others, reinforce the importance for learning analytics to start with “a clear understanding of the questions to be answered” (p. 47) or the task to be achieved.

If you start the design of a learning analytics tool/intervention without a clear idea of the task (and its context) in mind, then it’s going to be difficult to implement.

In our discussions in NZ, I’d actually forgotten about this focus in the original paper. This perhaps reinforces the need for IRAC to become PIRAC. To explicitly make purpose the initial consideration.

Beyond increasing focus on the task, purpose also brings in the broader organisational, personal, and political considerations that are inherent in this type of work.

So perhaps purpose encapsulates

  1. Why are we doing this? What’s the purpose?
    Reading between the lines, this particular project seems to be driven more by the availability of the tool and a person with the expertise to do stuff with the tool. The creation of a dashboard seems the strongest reason given.
    Tied in with seems to be the point that the institution needs to be seen to be responding to the “learning analytics” fad (the FOMO problem). Related to this will, no doubt, be some idea that by doing something in this area, learning and teaching will improve.
  2. What’s the actual task we’re trying to support?
    In terms of a specific L&T task, nothing is mentioned.
  3. Who is involved? Who are they? etc.
    The apparent assumption is that it is teaching staff. The integrated dashboard will be used by staff to improve teaching?

Personally, I’ve found thinking about these different perspectives useful. Wonder if anyone else will?

(P)IRAC analysis for the integrated dashboard project

What follows is a more concerted effort to use PIRAC to think about the project. Mainly to see if I can come up with some useful questions/contributions for Monday.

Purpose

  • Purpose
    As above the purpose appears to be to use the data warehouse.

    Questions:

    • What’s the actual BI/data warehouse application(s)?
    • What’s the usage of the BI/data warehouse at the moment?
    • What’s it used for?
    • What is the difference in purpose in using the BI/data warehouse tool versus Moodle analytics plugins or standard Moodle reports?
  • Task
    Without knowing what the tool can do I’m left with pondering what information related tasks that are currently frustrating or limited. A list might include

    1. Knowing who my students are, where they are, what they are studying, what they’ve studied and when the add/drop the course (in a way that I can leverage).
      Which is part of what I’m doing here.
    2. Having access to the results of course evaluation surveys in a form that I can analyse (e.g. with NVivo).
    3. How do I identify students who are not engaging, struggling, not learning, doing fantastic and intervene?

    Questions:

    • Can the “dashboards” help with the tasks above?
    • What are the tasks that a dashboard can help with that isn’t available in the Moodle reports?
  • Who
  • Context

What might be some potential sources for a task?

  1. Existing practice
    e.g. what are staff currently using in terms of Moodle reports and is that good/bad/indifferent?

  2. Widespread problems?
    What are the problems faced by teaching staff?
  3. Specific pedagogical goals?
  4. Espoused institutional priorities?
    Personalised learning appears to be one. What are others?

Questions:

  • How are staff using existing Moodle reports and analytics plugins?
  • How are they using the BI tools?
  • What are widespread problems facing teaching staff?
  • What is important to the institution?

Information

The simple questions

  • What information is technically available?
    It appears that the data warehouse includes data on

    • enrolment load
      Apparently aimed more at trends, but can do semester numbers.
    • Completion of courses and programs.
    • Recruitment and admission
      The description of what’s included in this isn’t clear.
    • Student evaluation and surveys
      Appears to include institutional and external evaluation results. Could be useful.

    As I view the dashboards, I do find myself asking questions (fairly unimportant ones) related to the data that is available, rather than the data that is important.

    Questions

    • Does the data warehouse/BI system know who’s teaching what when?
    • When/what information is accessible from Moodle, Mahara and other teaching systems?
    • Can the BI system enrolment load information drill down to course and cohort levels?
    • What type of information is included in the recruitment and admission data that might be useful to teaching staff?
    • Can we get access to course evaluation surveys for courses in a flexible format?
  • What information is ethically available?

Given the absence of a specific task, it would appear

Representation

  • What types of representation are available?
    It would appear that the dashboards etc are being implemented with PerformancePoint hence it’s integration with Sharepoint (off to a strong start there). I assume relying on its “dashboards” feature hence meaning it can do this. So there would appear to be a requirement for Silverlight to see some of the representations

    Questions

    • Can the data warehouse provide flexible/primitive access to data?
      i.e. CSV, text or direct database connections?
  • What is knowledge is required to view those representations?
    There doesn’t appear to be much in the way of contextual help with the existing dashboards. You have to know what the labels/terminology mean. Which may not be a problem for the people for whom the existing dashboards are intended.
  • What is the process for viewing these representations?

Affordances

Based on the information above about the tool, it would appear that there are no real affordances that the dashboard system can provide. It will tend to be limited to representing information.

  • What functionality does the tool allow people to do?
  • What knowledge and other resources are required to effectively use that functionality?

Change

  • Who, how, how regularly and with what cost can the
    1. Purpose;
      Will need to be approved via whatever governance process exists.
    2. Information;
      This would be fairly constrained. I can’t see much of the above information changing. At least not in terms of getting access to more or different data. The question about ethics could potentially meant that there would be less information available.
    3. Representation; and,
      Essentially this would appear that all the dashboards can change. Any change will be limited by the specifics of the tool
    4. Affordances.
      You can’t change what you don’t have.

    be changed?

Adding some learning process analytics to EDC3100

In Jones and Clark (2014) we drew on Damien’s (Clark) development of the Moodle Activity Viewer (MAV) as an example of how bricolage, affordances and distribution (the BAD mindset) can add some value to institutional e-learning. My empirical contribution to that paper was talking about how I’d extended MAV so that when I was answering a student query in a discussion forum I could quickly see relevant information about that student (e.g. their major, which education system they would likely be teaching into etc).

A major point of that exercise was that it was very difficult to actually get access to that data at all. Let alone get access to that data within the online learning environment for the course. At least if I had to wait upon the institutional systems and processes to lumber into action.

As this post evolved, it’s become also an early test to see if the IRAC framework can offer some guidance in designing the extension of this tool by adding some learning process analytics. The result of this post

  1. Defines learning process analytics.
  2. Applies that definition to my course.
  3. Uses the IRAC framework to show off the current mockup of the tool and think about what other features might be added.

Very keen to hear some suggestions on the last point.

At this stage, the tool is working but only the student details are being displayed. The rest of the tool is simply showing the static mockup. This afternoon’s task is to start implementing the learning process analytics functionality.

Some ad hoc questions/reflections that arise from this post

  1. How is the idea of learning process analytics going to be influenced by the inherent tension between the tendency for e-learning systems to be generic and the incredible diversity of learning designs?
  2. Can generic learning process analytics tools help learners and teachers understand what’s going on in widely different learning designs?
  3. How can you the diversity of learning designs (and contexts) be supported by learning process analytics?
  4. Can a bottom-up approach work better than a top-down?
  5. Do I have any chance of convincing the institution that they should provide me with
    1. Appropriate access to the Moodle and Peoplesoft database; and,
    2. A server on which to install and modify software?

Learning process analytics

The following outlines the planning and implementation of the extension of that tool through the addition of process analytics. Schneider et al (2012) (a new reference I’ve just stumbled across) define learning process analytics

as a collection of methods that allow teachers
and learners to understand what is going on in a learning scenario, i.e. what participants work(ed) on, how they interact(ed), what they produced(ed), what tools they use(ed), in which physical and virtual location, etc. (p. 1632)

and a bit later on learning scenario and learning process analytics are defined as

as the measurement and collection of learner actions and learner productions, organized to provide feedback to learners, groups of learners and teachers during a teaching/learning situation. (p. 1632)

This is a nice definition in terms of what I want to achieve. My specific aim is to

collect, measure, organise and display learner actions and learner productions to provide feedback to the teacher during a teaching/learning situation

Two main reasons for the focus on providing this information to the teacher

  1. I don’t have the resources or the technology (yet) to easily provide this information to the learners.
    The method I’m using here relies on servers and databases residing on my computer (a laptop). Not something I can scale to the students in my class. I could perhaps look at using an external server (the institution doesn’t provide servers) but that would be a little difficult (I haven’t done it before) and potentially get me in trouble with the institution (not worth the hassle just yet).

    As it stands, I won’t even be able to provide this information to the other staff teaching into my course.

  2. It’s easier to see how I can (will?) use this information to improve my teaching and hopefully student learning.
    It’s harder to see how/if learners might use any sort of information to improve their learning.

Providing this information to me is the low hanging fruit. If it works, then I can perhaps reach for the fruit higher up.

Learner actions and productions

What are the learner actions and productions I’m going to generate analytics from?

The current course design means that students will be

  1. Using and completing a range of activities and resources contained on the course site and organised into weekly learning paths.
    These actions are in turn illustrated through a range of data including

    • Raw clicks around the course site stored in system logs.
    • Activity completion.
      i.e. if a student has viewed all pages in a resource, completed a quiz, or posted the required contributions to a discussion forum they are counted as completing an activity. Students get marks for completing activities.
    • Data specific to each activity.
      i.e. the content of the posts they contributed to a forum, the answers they gave on a quiz.
  2. Posting to their individual blog (external to institutional systems) for the course.
    Students get marks for # of posts, average word count and links to other students and external resources.
  3. Completing assignments.
  4. Contributing to discussions on various forms of social media.
    Some officially associated with the course (e.g. Diigo and others unofficially (student Facebook groups).

I can’t use some of the above as I do not have access to the data. Private student Facebook groups is one example, but the more prevalent is institutional data that I’m unable to access. In fact, the only data I can easily get access to is

  • Student blog posts; and,
  • Activity completion data.

So that’s what I’ll focus on. Obviously there is a danger here that what I can measure (or in this case access) is what becomes important. On the plus side, the design of this course does place significant importance on the learning activities students undertake and the blog posts. It appears what I can measure is actually important.

Here’s where I’m thinking that the IRAC framework can scaffold the design of what I’m doing.

Information

Is all the relevant Information and only the relevant information available?

Two broad sources of information

  1. Blog posts.
    I’ll be running a duplicate version of the BIM module in a Moodle install running on my laptop. BIM will keep a mirror of all the posts students make to their blogs. The information in the database will include

    • Date, time, link and total for each post.
    • A copy of the HTML for the post.
    • The total number of posts made so far, the url for the blog its feed.
  2. Activity completion.
    I’ll have to set up a manual process for importing activity completion data into a database on my computer. For each activity I will have access to the date and time when the student completed the activity (if they have).

What type of analysis or manipulation can I perform on this information?

At the moment, not a lot. I don’t have a development environment that will allow me to run lots of complex algorithms over this data. This will have to evolve over time. What do I want to be able to do initially? An early incomplete list of some questions

  1. When was the last time the student posted to their blog?
  2. How many blog posts have they contributed? What were they titled? What is the link to those posts?
  3. Are the blog posts spread out over time?
  4. Who are the other students they’ve linked to?
  5. What activities have they completed? How long ago?
  6. Does it appear they’ve engaged in a bit of task corruption in completing the activities?
    e.g. is there a sequence of activities that were completed very quickly?

Representation

Does the representation of the information aid the task being undertaken?

The task here is basically giving me some information about the student progress.

For now it’s going to be a simple extension to the approach talked about in the paper. i.e. whenever my browser sees on a course website a a link to a user profile, it will add a link [Details] next to it. If I click on that link I see a popup showing information about that student. The following is a mockup (click on the images to see a larger version) of what is currently partially working

001 - Personal Details

By default the student details are shown. There are two other tabs, one for activity completion and one for blog posts.

Requirement suggestion: Add into the title of each tab some initial information. e.g. Activity completion should include something like “(55%)” indicating the percentage of activities currently completed. Or perhaps it might be the percentage of the current week’s activities that have been completed (or perhaps the current module).

The activity completion tab is currently the most complicated and the ugliest. Moving the mouse of the Activity Completion tab brings up the following.

002 - Activity completion

The red, green and yellow colours are ugly and are intended to indicate a simple traffic light representation. Green means all complete, red is not, yellow means in progress for some scale.

The course is actually broken up into 3 modules. The image above shows each module being represented. Open up a module and you see the list of weeks for that module – also with the traffic light colours. Click on a particular week and you see the list of activities for that week. Also with colours, but also with the date when the student completed the activity.

Requirement suggestion: The title bars for the weeks and modules could show the first and last time the student completed an activity in that week/module.

Requirement suggestion: The date/time when an activity was completed could be a roll-over. Move the mouse over the date/time and it will change the date/time to how long ago that was.

Requirement suggestion: What about showing the percentage of students who have completed activities? Each activity could show the % of students who had completed it. Each week could show the percentage of students who had completed that week’s activities. Each module could….

Requirement suggestion: Find some better colours.

The blog post tab is the most under-developed. The mockup currently only shows some raw data that is used to generate the students mark.

003- blog posts

Update The following screen shot shows progress on this tab. The following is from the working tool.

BlogProcessAnalytics

Requirement suggestions:

  • Show a list of recent blog post titles that are also links to those posts.
    Knowing what the student has (or hasn’t) blogged recently may give some insight into their experience.
    Done: see above image.
  • Show the names of students where this student has linked to their blog posts.
  • Organise the statistics into Modules and show the interim mark they’d get.
    This would be of immediate interest to the students.

Affordances

Are there appropriate Affordances for action?

What functionality can this tool provide to me that will help?

Initially it may simply be the display of the information. I’ll be left to my own devices to do something with it.

Have to admit to being unable to think of anything useful, just yet.

Change

How will the information, representation and the affordances be Changed?

Some quick answers

  1. ATM, I’m the only one using this tool and it’s all running from my laptop. Hence no worry about impact on others if I make changes to what the tool does. Allows some rapid experimentation.
  2. Convincing the organisation to provide an API or some other form of access directly (and safely/appropriately) to the Moodle database would be the biggest/easiest way to change the information.
  3. Exploring additional algorithms that could reveal new insights and affordances is also a good source.
  4. Currently the design of the tool and its environment is quite kludgy. Some decent design could make this particularly flexible.
    e.g. simply having the server return JSON data rather than HTML and having some capacity on the client side to format that data could enable some experimentation and change.

References

Schneider, D. K., Class, B., Benetos, K., Lange, M., Internet, R., Developer, A., & Zealand, N. (2012). Requirements for learning scenario and learning process analytics. In World Conference on Educational Multimedia, Hypermedia and Telecommunications (pp. 1632–1641).

Designing for situation awareness in a complex system

The following is a summary and probably some thoughts on

Endsley, M. (2001). Designing for Situation Awareness in Complex System. In Proceedings of the Second International Workshop on the symbiosis of humans, artifacts and environment. Kyoto, Japan.

@beerc is excited by some of the potential of this and related work for university e-learning. It seems to fit with our thoughts that most universities and the individuals therein aren’t even scratching the surface in terms of what technology could offer.

My initial thoughts

I like some of the initial outlining of the problem, however, I think the solution smacks too much of the complicated systems approach, rather than the complex adaptive approach. The solution is essentially a specialised waterfall model (requirements/design/evaluate) with a focus on situation awareness. There’s some interesting stuff there, but I’m not sure how applicable it is to university e-learning. I remain leery of this idea that experts can come in an analyse the problem and fix it. It needs to be more evolutionary.

There are some nice quotes for higher ed and its systems.

The challenge of the information age

“The problem is no longer lack of information, but finding what is needed when it is needed.” Actually, I’d have to argue that when it comes to information about the learners in the courses I teach, I’m still suffering the former problem when it should be the latter.

Describes “The information gap” where “more data != more information”. Draws on some of the common explanations.

From data to information

Draws on a Bennis (1977) quote “This post-technological age has been defined as one in which only those who have the right information, the strategic knowledge, and the handy facts can make it”….makes the point “making the right decisions will depend on having a good grasp of the true picture of the situation”.

The overflow of data needs translating into information. But it will “need to be processed and interpreted slightly differently by different individuals, each of whom has varied dynamically changing but inter-related information needs”.

This translation “depends on understanding how peopel process and utilize information in the decision making activities”

Understanding “human error”

A few examples of this before “the biggest challenge within most industries and the most likely cause of an accident receives teh label of human error. This is a most misleading term, however, that has done much to sweep the real problems under the rug.”

Instead it’s argued that the human was “striving against significant challenges”….coping “with hugely demanding complex systems”. Overload in terms of data and technology. This is addressed through long lists of procedures and checklists which are apt to eventually fail. Instead

The human being is not the cause of these errors, but the final dumping ground for the inherent problems and difficulties in the technologiges we have created. The operator is usually the one who must bring it all together and overcome whatever failures and inefficiencies exist in the system

This resonates quite strongly with my experience at different universities when trying to teach a large course with the provided information systems.

Situation awareness: The key to providing information

“Developing and maintaining a high level of situation awareness is the most difficult part of many jobs”. SA is defined as “an internalised mental model of the current state of the operator’s environment…..This integrated picture forms the central organising feature from which all decision making and action takes place”.

Developing and keeping SA up to date makes up a vast portion of the person’s job.

“The key to coping in the ‘information age’ is developing systems that support this process. This is where our current technologies have left human operators the most vulnerable to error.”…..cites research that shows SA problems were “the leading causal factor”.

I wonder if such research could be done in a contemporary university setting?

Success will come is you can combine and present the vast amounts of data in a way that provides SA. “The key here is in understanding that true situation awareness only exists in the mind of the human operator”.

This is an interesting point given the rush to automated analytics.

The successful improvement of SA through design or training problems requires the guidance of a clear understanding of SA requirements in the domain, the individual, system and environmental factors that affect SA, and a design process that specifically addresses SA in a systematic fashion

SA defined

Citing Endsley (1988) SA is defined as

the perception of the elements in the environment within a volume of time and space, the comprehension of their meaning and the projection of their status in the near future”

and there a levels of SA

  1. Perception of the elements in the environment

    “perceiving the status, attributes and dynamics of relevant elements in the environment”

  2. Comprehension of the current situation

    More than awareness of the elements, includes “an understanding of the significance of those elements in light of one’s goals”.

    A novice operator may achieve the same Level 1 SA as an experienced operator, but will likely fall short at Level 2.

  3. Projection of future status

    What are the elements in the environment going to do?

Theoretical underpinnings

Links to broader literature that has developed a theoretical framework model. Apparently heavily based on the cognitivist/psychology research. Working memory, long term memory etc. e.g. Fracker’s (1987) hypothesis that working memory is the main bottleneck for situational awareness and other perspectives. Mental models/schema get a mention as a solution.

“Of prime importance is that this process can be almost instantaneous due to the superior abilities of human pattern matching mechanisms”. Hence the importance of expertise and experience.

Designing for situation awareness enhancement

The type of systems integration required for SA

usually requires very unique combinations of information and portrayals of information that go far beyond the black box “technology oriented” approaches of the past

Designing these systems is complex, but progress made. Too complex to cover here, but talks about three major steps

  1. SA requirements analysis

    Frequently done with a form of cognitive task analysis/goal-directed task analysis. The point is that goals/objectives form the focus, NOT tasks.

    Done using a combination of cognitive engineering procedures with a number of operators.

    Done (with references) in many domains.

  2. SA-Oriented design

    Presents 6 design principles for SA, that is also applicable more broadly.

  3. Measurement of SA in design evaluation

    Mentions the Situation Awareness Global Assessment Technique (SAGAT) measuring operator SA.

When initially reading those three steps my first reaction was “Arggh, it’s the SDLC/waterfall model all over again. That’s extremely disappointing”. I then started wondering if this was because they are thinking of complicated systems, not complex adaptive systems?

MAV, #moodle, process analytics and how I'm an idiot

I’m currently analysing the structure of a course I teach and have been using @damoclarky’s Moodle Activity Viewer to help with that. In the process, I’ve discovered that I’m an idiot in having missed the much more interesting and useful application of MAV than what I’ve mentioned previously. The following explains (at least one example of) how I’m an idiot and how MAV can help provide a type of process analytics as defined by Lockyer et al (2013).

Process analytics

In summary, Lockyer et al (2013) define process analytics as one of two broad categories of learning analtyics that can help inform learning design. Process analytics provide insight into “learner information processing and knowledge application … within the tasks that the student completes as part of a learning design” (Lockyer et al, 2013, p. 1448). As an example, they mention the use of social network analysis of student discussion activity to gain insights into engaged a student is with the activity and who the student is connecting with within the forum.

The idea is that a learning analytics application becomes really useful when combined with the pedagogical intent of the person who designed the activity. The numbers and pretty pictures by themselves are more valuable in combination with teacher knowledge.

A MAV example – Introduction discussion forum

I’m currently looking through the last offering of my course, trying to figure out what worked and what needs to be changed. As part of this, I’m drawing on MAV to give me some idea of how many students clicked on particular parts of the course site and how many times they did click. At this level, MAV is an example of a very primitive type of learning analytics.

Up until now, I’ve been using MAV to look at the course home page as captured in this large screen shot. When I talk about MAV, this is what I show people. But now that I actually have MAV on a computer where I can play with it, I’ve discovered that MAV actually generates an access heat map on any page produced by Moodle.

This includes discussion forums, as shown in the following image (click on it to see a larger version).

Forum students by David T Jones, on Flickr

This is a modified (I’ve blurred out the names of students) capture of the Introduction discussion forum from week 1 of the course. This is where students are meant to post a brief introduction to themselves, including a link to their newly minted blog.

With a standard Moodle discussion forum, you can see information such as: how many replies to each thread; who started the thread; and, who made the last post. What Moodle doesn’t show you is how many students have viewed those introductions. Given the pedagogical purpose of this activity is for students to read about other students, knowing if they are actually even looking at the posts is useful information.

MAV provides that information. The above image is MAV’s representation of the forum showing the number of students who have clicked each link. The following image is MAV’s representation of the number of clicks on each link.

Forum clicks by David T Jones, on Flickr

What can I derive from these images by combining the “analytics” of MAV with my knowledge of the pedagogical intent?

  • Late posts really didn’t help make connections.

    The forum is showing the posts from most recent to least recent. i.e. the posts near the top are the late posts. This forum is part of week 1, which was 15th to 19th of July, 2013. The most recent reply (someone posting their introduction) was made in Oct. Subsequent posts are from 7th to 10th August, almost a month after the task was initially due (the first assignment was due 12th August, completing this task contributed a small part of the mark for the first assignment).

    These late posts had really very limited views. No more than 4 students viewing them.

  • But then neither did many of them.

    Beyond the main thread started by my introduction, the most “popular” other introduction was clicked on 41 times by 22 students (out of 91 in the course). Most were significantly less than this.

    Students appear not to place any importance on reading the introductions of others. i.e. the intent is not being achieved.

  • Students didn’t bother looking at my Moodle profile.

    The right hand column of the images shows the name of the author and the time/date of the last post in a thread. The author’s name is also a link to their Moodle profile.

    MAV has generated an access heat map for all the links, including these. There are no clicks on my profile link. This may be because the course site has a specific “Meet the teaching team” page, or it maybe they simply don’t care about learning more about me.

  • It appears students who posted in a timely manner had more people looking at their profiles.

    This is a bit of stretch, but the folk who provided the last post to messages toward the bottom of the above images tend to have higher clicks on their profile than those later in the semester. For example, 19, 22, and 12 for the three students providing the last posts for the earliest posts, and, 1, 1, and 7 for the students providing the last post for the more recent posts.

  • Should I limit this forum to one thread?

    The most popular thread is the one containing my introduction (549 clicks, 87 students). Many students posted their introduction as a reply to my introduction. However, of the 122 replies to my post, I posted 30+ of those replies.

In short, I need to rethink this activity.

Implications

I wonder if the networks between student blog posts differs depending on when they posted to this discussion forum? Assuming that posting to this discussion forum on time is an indicator of engagement with the pedagogical intent?

If the aim behind an institutional learning analytics intervention is to improve learning and teaching, then perhaps there is no need for a complex, large scale enterprise (expensive) data warehouse project. Perhaps what is needed is the provision of simple – but currently invisible information/analysis – via a representation that is embedded within the context of learning and teaching and thus makes it easier for the pedagogical designer to combine the analytics with their knowledge of the pedagogical intent.

Answering the questions of what information/analysis and what representation is perhaps best understood by engaging and understanding existing practice.

@damoclarky needs to be encouraged to do some more writing and work on MAV and related ideas.

References

Lockyer, L., Heathcote, E., & Dawson, S. (2013). Informing Pedagogical Action: Aligning Learning Analytics With Learning Design. American Behavioral Scientist, 57(10), 1439–1459. doi:10.1177/0002764213479367

Blogs, learning analytics, IRAC and BIM

In 2014 I am hoping to make some changes to BIM that will enhance the course I’ll be teaching. The hope is to leverage various learning analytics to enhance student learning. The following is an attempt to use the IRAC framework to think about what might be done. Essentially a bit of brainstorming about possible future development.

Each of the headings below link to the IRAC framework. First off the content and the purpose of this use of learning analytics is described. Then each of the four components of the IRAC framework – Information, Representation, Affordances and Change – are considered.

I’ve just learnt about the proceedings from the 3rd Workshop on Awareness and Reflection in Technology-Enhanced Learning, will need to read through that content for any additional insights.

Context

The course is a 3rd year course in a Bachelor of Education. It’s taken by folk hoping to become teachers at every level from prep, through Grade 12 and into the VET sector. The focus is the students be able to use Information and Communication Technologies to enhance/transform the learning of their students. During the course the students complete a three week practical in a school setting. The course is offered twice a year. The first offering has average around 300 students spread over three campuses and online. The second offering averages around 100 students all online. The students in the course are not necessarily all that ICT literate.

The students are required to maintain an individual blog that they use as a learning journal. The learning journal is intended to be used for capturing experiences, feelings and reflections. Contributions to the learning journal contribute 15% of the final mark. There is no formal marking of blog posts. Marking is done on the basis of the number of posts per week, the average word count, and the number of links to both external resources and blog posts from other students.

2013 was the first year the learning journal assessment was used. All 2013 student blog posts are archived in two instances of BIM. The plan is to use learning analytics to explore this data and test out various approaches that could be integrated into BIM and the course’s operation in 2014.

Purpose

At a high level, improve student learning while keeping the staff workload appropriate. Briefly, the pedagogy in the course is trying to encourage students’ self-regulation, reflection and building a PLN/making connections. I want the students to take ownership of their learning around ICTs and Pedagogy and for them to create and share a range of artefacts, insights and perhaps knowledge. The purpose that learning analytics can play in this is helping both the students achieve this and help the teaching staff support this.

Some high level aims for harnessing learning analytics.

  1. Provide students with some idea of how they are going and perhaps more importantly how to improve.
  2. Increase the diversity, quantity and quality of the connections between students and their posts and blogs.
  3. Allow teaching staff to identify who is struggling, who is doing well and who is in between and then help support staff in engaging appropriately.

A quick skim of 2013 course evaluation responses reveal some comments (emphasis added) from the semester 1 offering

The blog is a good idea to ensure the students are trying new ICTs during the course however the assessment was pointless. There was no real reason for us to be writing a certain amount of blogs per week. I found it a nuisance to maintain (on-campus student)

Probably the blogging was unnecessary but I still didn’t mind that. (on-campus student)

The blogs were very time consuming – and considering they were marked without being reviewed/marked then I am concerned that we could have done what ever we wanted! (on-campus student)

I also found blogging to be very beneficial in building my PLN (online student – most effective aspects of the course)

being forced to blog was actually great as it brought online students together as we shared resources and got to know each other. (online student – most effective aspects of the course)

the blog we had to keep, it had no purpose to it (online student – least effective aspect of the course)

the amount of blogs expected (online student – least effective aspect of the course)

The blogging, although I can see why we had to do it, I found it was hard to keep to the time frames as an online student (online student – least effective aspect of the course)

I don’t believe that I gained from blogging 3 times per week. I would rather have been assess on the quality of 1 blog per week and professional feedback that I could have provided to another student (rather than just links in the 3 blogs) (online student – least effective aspect of the course)

There were other comments on the blogs, common themes so far seem to be

  • The purpose of the blogs was non-existent to some, especially given that they weren’t marked based on quality by a human.
  • Blogs were potentially seen as more problematic in Semester 1 because of other issues with the course.

Change

Change is actually the last part of the IRAC acronym, but I’ll put it first. Mainly because it is the IRAC components that is least considered in learning analytics related projects (IMHO) and the one that I think is the most important.

In this case, I can see there needing to be three types of change considered: going outside of Moodle, using features inside of Moodle, and insidie BIM.

Outside Moodle

In short, thinking about, designing and implementing the type of changes to BIM and pedagogy outlined below is inherently a learning experience. I’m not smart enough to predict what is going to happen prior to implementation. I always gain insight when engaged in these activities that I want to leverage straight way into new approaches and new technological capabilities. i.e. I want to be able to make changes to BIM during the semester.

Not something I can do with the standard processes used for supporting a Universities institutional LMS. Hence the need to look at how I can do changes to BIM outside of Moodle and the institutional installation. In 2013, I did this via a kludge, essentially some Perl scripts and a version of Moodle/BIM running on my laptop.

Beyond the constraints of the institutional LMS processes, there’s the question of information and resources other than what is typically available to a Moodle module. Some examples include

  • Activity completion.

    Currently a small part of the 15% for the learning journal assessment in this course is based on students completing the activities for set weeks. This is in Moodle, but a module like BIM will typically not be able/expected to access this information.

    QUESTION: Can/how a module access information from other parts of a Moodle course site?

  • Student demographic and academic data.

    e.g. GPA of a student, how many times they’ve taken the course, might be used to help identify those at risk. Typically not information in Moodle.

  • Student dispositions.

    Data about students dispositions and self-regulation may be useful (see below) in providing advice. This would have to be gathered via surveys and would not be normally in Moodle.

  • Computationally heavy analytics.

    It is likely that a range of natural language processing and other potentially computationally heavy algorithms could be used to analyse student posts. Most enterprise IT folk are not going to want to run these algorithms on the same server as the institutional LMS.

All of this combined, means I’ll likely explore the use of LTI mentioned in this post from earlier in the year. i.e. use LTI to enable the version of BIM used in the course to be hosted on another server. A server only used for BIM in this course so that change can happen more rapidly.

In addition, that other server is also likely to run a range of other software for the computationally heavy analytics – rather than try and shoe-horn it into a Moodle module.

Inside Moodle

There’s a line of though – with which I agree – that learning analytics are most useful when supporting a specific learning design. The more specific, the more useful. This is in tension with the tendency of LMS tools to being generic. For example, much of what I’m talking about here moves BIM away from it’s original pedagogy of students answering questions to be marked by markers toward a more connectivist approach. Becoming more specific may limit the people who can use BIM. Not a big worry at the moment, but a consideration.

Moodle 2.0 has evolved somewhat in its ability to support change. For example, the introduction of renderers separates out the representation of BIM from the data and allows different themes to override a rendered. In theory, allowing other people to modify what is shown. However, the connection with a theme is potentially a bit limiting.

Task: Explore the concept of renderers more often.

Inside BIM

There is much that could be done to the structure of BIM to enable and support rapid development. e.g. Moodle is now supporting unit tests, BIM needs to move toward supporting this.

Information

To scaffold this look at the information that could be drawn upon, I’ll use the DAI acronym. i.e. the information to be used in learning analytics can be listed as

  • Data – raw data that is the starting point (e.g. blog posts for BIM).
  • Analysis – what method/algorithm is going to be used to analyse and transform the source information into….
  • Insight or perhaps Information – something that potentially reveals something new (e.g. how good is the reflection in this blog post)

Source

Information we currently have access to

  • All student blog posts from 2013.

    As part of the BIM database tables in the Moodle database.

  • The date and time when posts were made.
  • Student performance on assignments and in the course.

    Currently in a database in another non-Moodle assignment submission system. Pondering if this needs to move to the Moodle assignment submission system and thus the Moodle gradebook. But which raises a question..

    Question: Can/how would a module like BIM get access to Moodle gradebook data in the same course?

  • Some student demographic data.

    Currently as a CSV file manually downloaded from Peoplesoft by someone else. Includes age, postcode, sector, GPA.

  • Course and institution related dates.

    e.g. assignment due dates, semester start and end dates etc.

Information that we don’t have access to, but which might be useful

  • Comments on student blog posts.

    There’s no really standard way between different blogging engines of tracking and archiving the comments made on blog posts. So we don’t record those. Anecdotal observations suggest that many of the “connections” between students occur as comments. EduFeedr did some work around this.

  • Student perceptions of the learning journal assessment.

    Might be some mention in the 2013 course evaluation results.

    TASK: Take a look at the 2013 course evaluation results and see what mention is made.

  • Student dispositions and mindsets – e.g. this work.

Analysis

A very limited list of possible forms of analysis on the information we currently have

  • Link and social network analysis etc.

    Who is linking to who? etc.

  • Natural language processing, computational linguistics etc – which might open up possibilites such as

Combining the above with student demographic information and dispositions could also reveal interesting correlations and relationships.

I need to become more aware of what possible forms of analysis might exist. At the same time, the list of affordances (see below) may also suggest forms of analysis that are required.

Representation

Early suggestions for representation might include

  • Social network diagrams of various types.

    For students and teachers to see the structure and evolution of the social network of posts/blogs. e.g. this EduFeedr scenario

  • “My progress”

    Allow students to see a collection of stats about their blog and to see it in connection with others.

  • Student posting

The work reported in this paper on using badges gives on possibility for representation and also in terms of affordances for students to compare what they’re doing with others.

Affordances

The actual definition of affordances in the IRAC framwork – like the IRAC framework itself – is still in the early days of refinement. Here I’m going to use affordances as functionality that BIM might provide. Obviously influenced by the purpose from above.

  • Help students find interesting and relevant posts from other students.
  • Help students find interesting and relevant external links.
  • Allow students to see how “good” their blog is.
  • Show students how their blog compares to other students.

    There are reservations about this.

  • Allow all participants to get some idea of the important topics being discussed each week and over other time periods.
  • Show staff a progress bar/heat map/visualisation of some sort of student progress against expected milestones/questions.

    The EduFeedr progress visualisation below (click on it to see it bigger) is an inspiration.

  • Help staff to intervene and track interventions with all students.
  • Support staff in creating auto-marking approaches.

EduFeedr Progress

Measuring impact and improvement

If we ever get around to doing something in 2014, how will we know what’s changed? Alternatively, what might be useful to learn about the use of the student blogs in 2013?

Some possibilities

  • When did student post?

    Students were expected to have a number of posts each week, however, it was only assessed over a 3 or 4 week period.

    • How many students posted consistently each week and how many did the mad dash toward the end of the 3 or 4 week period?
    • Was there any correlation between when posts were made and the content of the posts, the students performance in the course, their GPA or anything else?
  • How did (if at all) did student posts change over the semester?
    • Is it possible to tell when holidays, professional experience, other assignments were due etc. from the student posts?
    • Did the emotions in posts change over semester?

      The course is quite heavy going. Especially in the first few weeks. I would expect some great nashing of teeth in the early weeks and perhaps in the leadup to assessment.

    • How did the connections between posts/students change over the semester?
  • Is it possible to develop indicators that might identify certain types of students/posts?
    • Indicators to identify students who are about to drop out?
    • Indicators to identify popular posts?
    • Indicators of students at all levels?

      e.g. what does a “good” student write about that an “ok” student writes about?

  • What were the most mentioned concepts during the semester?

To do

Some tasks left to do include, in no particular order

  • 2013 blog posts
    • Do some analysis of the 2013 blog posts.
    • Test out some of the planned analytics on these posts.
  • BIM
    • Explore the transition to renderers.
    • Explore unit tests.
    • Explore the “Moodle way” for assignments, marking, rubrics, outcomes etc.
    • Develop the “automated” marking feature.
    • Explore how the select “analytics” features will be identified.
  • LTI
    • Identify a good external hosting service.
    • Confirm that an LTI version of BIM will work with the course.
  • Purpose
    • Clarify exactly what pedagogical aims are going to be valuable.
    • Explore the self-regulated learning literature.
    • Look at the course evaluation responses from 2013 and see if there’s anything important to address.
    • Eventually identify a specific set of outcomes I want to work toward.
  • Information
    • Explore the various analysis methods that could be useful.
    • Explore how the analysis is best done with BIM, Moodle and PHP.
  • Representation
    • Explore how/if badges might be a possibility? USQ Moodle version and capabilities.
    • What PHP support is there for visualising social network diagrams?
  • Affordances
    • Get more into the literature around affordances, especially any work people have done on how to design affordances for learning/teaching.

Page 1 of 2

Powered by WordPress & Theme by Anders Norén

css.php