Assembling the heterogeneous elements for (digital) learning

Month: March 2012

bim2 – student and marker fixes

Some more work on bim2, carrying on from last night. Aim here is to attack some of these tasks:

  • Fix problem with mirroring of student feeds.
  • Double check the marker screens.

Mirroring of student feeds

Last night I proposed three possible causes

  1. The caching/operation of the Moodle 2 version of Simplepie and bim.
  2. Left over database entries not cleaned up appropriately during testing.
  3. Errors crept into the mirroring code due to Moodle 2 database API changes.

Is bim2 currently using the Moodle2 version of the SimplePie library for mirroring, rss parsing etc.

[sourcecode language=”language="php”]
require_once( $CFG->libdir.’/simplepie/moodle_simplepie.php’ );
[/sourcecode]

Check.

Let’s try a brand new student. Yes, same problem. Is not mirroring the feed properly. Keeps adding all the new stuff. Is inserting the same entry into the database each time, perhaps the problem is with the bim2 code.

So time to look at lib/bim_rss.php. Basic process is

  • Create details_link hash with key being link to posts in the dbase. – BROKEN
    Is giving an empty hash when there should be 6 entries….bim_get_marking_details is broken. Yep, hasn’t been moved across to the Moodle 2 dbase API.
  • Loop through items in the feed
    • if not already in the details_link hash
      • Prepare for entry, including checking if it’s an answer to a question.
      • insert it into the dbase

Minor display problems

In fixing this, there are some minor display problems to fix. This is also probably a porting issue.

  • “showquestions” – apparently meant to be details about questions, rather than a link to a label.
    “showquestions” is a link to the page where students can view the questions they have to answer. However, it should have some descriptive text here. It appears that link_to_popup_window is deprecated in Moodle 2.

    Not sure why this was a popup. Make it a normal window and move on…Oh joy, the language files are cached. Need to turn that off.

  • Links after “All posts” heading – descriptive text is a link
    Being caused by an unclosed anchor tag. Where is that shown? Ahh, lib/locallib.php – fixed.
  • Help buttons “TO DO” – all of them are to do.
    Another conversion not fixed. All those text files need to be moved into the lang file. Done.

That last task also helped test the various transitions that a post can go through: unallocated, allocated/submitted, marked, suspended and released.

At this stage, the student part of bim2 is a go.

implode

The problem with get_marking_details above was caused by unfinished porting of how SQL ” in ” statements are handled. The new “get_in_or_equal” method needs to be used.

This needs to be fixed before moving on. Need to search for implode.

Note: Will need to keep an eye on bim_get_all_marker_stats as it needs to be closely tested.

Marker “screens”

A marker can do the following

  • View student details
    Needed to fix the help popups. Done.

    • View various details about the students – WORKS
    • Download OPML file for their students
      Error in SQL. This is all done in marker/generateOpml.php. Seems the problem is in bim_get_markers_students. Actually the userid isn’t being passed in. that’s fixed.

      Another problem. It’s not actually returning anything for this marker. Actually, a range of problems from the bim1 code. This probably never worked.

      It does now.

    • Register a blog for a student
    • Send an email to all unregistered students – WORKS
  • Mark posts
    • View an overview of marking progress
    • Mark a particular post – which includes a range of changes

Will leave this for now.

Next time I need to continue going through the marker interface.

bim2 – status check and what's next

So it appears that bim2.0 is increasingly needed (if you don’t know what bim is, check this out). University of Canberra have gone to Moodle 2 and CQU are about to, the only two places I know that bim is being used. Most importantly, I’m now teaching at a Moodle Uni and am seriously thinking about using bim, and my Uni is about to move to Moodle 2.

In keeping with my practice, this post is another in a list of posts that serve as a development journal (mainly because I’m coding so infrequently now I need to remember how to do this stuff). The aim here is to figure out where the porting is up to and perhaps identify where next.

The current code for bim2 can be found in this branch on github. I’ll try to keep it up to date.

Current status

The last work reported

Most of the basic code for bim2 is working, but the capabilities aren’t. i.e. identifying the type of user and sending them to the right function.

Mmm, all are working, but not the coordinator.

As it stands the coordinator stuff is working. I wonder if that’s because of a hard-coded kludge. Mmm, no. It seems to be coded as required.

I did have earlier problems because of versioning, it appears that’s fixed now.

Let’s test the other user types and make sure they are working

  • Student – working, at least the redirect, the display leaves something to be desired.
  • Marker – working as well.
  • Coordinator (as a teacher, not as admin user) – bugger, that’s not working “error/No capability to access this page”

To do list

Which leads me to this basic to do list

  1. Test out the marker and student views of BIM and find out what’s not working.
  2. Fix what’s not working for marker and student
  3. Figure out why the “coordinating” teacher is not being identified as such.

Not identifying “coordinating” teacher

I can feel this being a bugger to identify where it’s going wrong, mostly because my knowledge of the Moodle capability system (let alone the Moodle 2.x capability system) is close to non-existent.

Ha! Noticed that the teacher account only had the role “Coordinator” set and that the access.php file was not looking for “Coordinator” as a role to treat as a bim “coordinator”. Added “teacher” as a role and it’s working.

Is “coordinator” a standard Moodle 2 role? No, it doesn’t look like it.

Amazing what some time away will do for perspective and clarity.

What’s working for the student role?

First, why aren’t the header/footer being displayed properly. Thinking I haven’t added appropriate stuff in “show_student”. Yep, have to call the print_header functions. Add that in, fix up the call to print the footer and we’re working.

So, what can a student do and what do I need to check

  • No feed registered
    • View bim – WORKS
    • Register invalid feed
      • URL is not a URL – WORKS
      • URL is not accessible – WORKS
      • URL is not a feed – WORKS
    • Register a valid feed – WORKS
  • Feed registered
    • view current details – with no new blog posts added. – WORKS
    • View current details – with new blog post added – Not working so well

Status for now

Most of the student functionality is working. However, every time the student is viewing their bim activity, the number of mirrored posts is going up by 10. Needs to be fixed.

Some potential causes to investigate

  • The caching/operation of the Moodle 2 version of Simplepie and bim.
  • Left over database entries not cleaned up appropriately during testing.
  • Errors crept into the mirroring code due to Moodle 2 database API changes.

Curriculum innovation as an educational technology trend

Came across this post titled “Five Trends to Watch in Education Technology” via Stephen Downes’ OLDaily. In particular, I was really drawn to trend #1 – the Curriculum. In particular, because it connects with some ideas that have burbling away for the least week or so sparked by some questions from a colleague.

Rob Reynolds’ take on Curriculum as a trend includes

Across education, the very notion of curriculum is changing in a number of ways. We are seeing a shift to newer literacies and are even beginning to entertain significant changes to what core content needs to be taught/learned. There is certainly a growing realization that curricula today must be more flexible and open, and that the idea of fixed/static bodies of important information to be taught no longer works.

I’m currently teaching a course that aims to help K12 teachers figure out how they are going to use Information and Communication Technologies in their teaching. It’s a fairly standard University course. It has a set textbook. A weekly schedule. A set curriculum. A couple of large assignments. A course website.

Within context/constraint there have been a few interesting innovations, but it’s all still constrained by the curriculum which is fairly set. It’s week 6 we must be covering “Topic X”.

I just don’t see this rigidity fitting nicely with the notion of a “more flexible and open” curricula.

Curriculum/student mismatch

It doesn’t help that the current curricula approach doesn’t really fit the needs of the students.

There are almost 300 students in this course this term. 120 of them entirely online. Around the same number are split between three different campuses. The next offering will have 100+ students, all of them online.

These students are split across a number of teaching specialisations, including: Early Childhood, Primary, Secondary (including various disciplinary specialisations), and Vocational Education and Training (VET). What it means to use ICTs in early childhood is entirely different in a VET context.

The students come with very different backgrounds in technology – ranging from ex-IT professionals through to “it breaks if I touch it” – and a broad array of ages. See the following graph that shows the age distribution.

age Distribution

In addition, the course is nominally a 3rd year course. Which suggests you can assume that the students have two years of study toward an education degree under their belt. Of course, this is not the case. With exemptions/bridging etc there are some students for whom this is their first course at University.

Given all this diversity it really isn’t all that possible to design a single path through a set curriculum that is going to be appropriate for all these students.

Double loop learning and constructive alignment

Current accepted practice within higher education courses is something along the lines of constructive alignment. I, as the expert, identify the outcomes the students should achieve. I then design assessments and activities that enable the students to develop and demonstrate those outcomes. As typically implemented this approach is the opposite of a “more flexible and open” curriculum. All students are expected to work towards the same goals, often using the same sequence of activities to get there.

Over recent years the Australian higher education sector – with its growing diversity of multiple campuses and alternate delivery modes – has faced requirements to demonstrate that all students are gaining an equivalent learning experience. The tendency has been for equivalence to be reduced to consistent learning experience. Further driving out any notion of a “more flexible and open” curriculum.

A couple of days ago I blogged about a talk given by Gardner Campbell. In it he references Naughton’s From Gutenberg to Zuckerberg and his discussion of “double-loop” learning

it is not enough for managers to adjust their behaviour in response to feedback on the success of their actions relative to pre-established targets; they also need to reflect on the appropriateness, in the light of unfolding events, of the assumptions (the mental model) used to set up those actions and targets

Substitute “learners” for “managers” and you have some idea of what I’ve been thinking about. Is it possible/plausible/desirable for a University course to have a “more flexible and open” curriculum that seeks to encourage and enable double-loop learning amongst the students?

Is it possible to break university managers etc out of the viewpoint that “innovation” around teaching and learning isn’t just about doing the old curriculum with the new technology, but is instead about developing new conceptions of what curriculum could be?

What are the really useful analytics?

Following on from recent posts around learning analytics, this post is going to try and drill down a bit further on one of the useful questions around analytics identified by Shelia MacNeil’s summary of a Gardner Campbell talk. The questions

What are the really useful “analytics” which can help me as a learner, teacher, administrator, etc? Which systems provide that data just now ? How can/do these stakeholders access and share the data in meaningful ways? How can we improve and build on these systems in ways which take into account the complexity of learning? Or as Gardner said, how can we start framing systems and questions around wisdom?

I’m going to focus on “What are the really useful “analytics” which can help me as a learner, teacher, administrator, etc?” and in particular on the “useful analytics” – I’ll call them patterns – that the Indicators project has identified so far.

So far, the Indicators project has really only looked for these useful patterns within one institution, though with a fairly large sample. The definition of useful here is something like “potentially of interest to learners, teachers or administrators”. In the short term, I’m hoping we can extend both the sample and also the number of institutions.

A side step into purpose

Before getting into that, a few words about the purpose of learning analytics. Barneveld et al (2012) suggest that there are some common business reasons behind analytics

: increasing financial/operational efficiency; expanding local and global impact; establishing new funding models during a changing economic climate; and responding to the demands for greater accountability

which appears to be taken from an IBM white paper

There follows an argument and some references that suggest analytics can help management a great deal to “cut costs and improve teaching and learning”. So much so that the following sentence repeats the mantra “improving efficiencies to saving money to enhancing student achievement”

While that’s certainly a potential application of analytics, like others I find this a limiting perspective. It almost automatically entails the sort of simplification that Gardner Campbell was arguing against.

Instead, I’m starting to lean more toward the idea of analytics being yet another “blind man” available to people to discover what is going on around e-learning/learning. Like the other blind men of e-learning research (I’ll use that term for want of a better label) – surveys, interviews etc. – it has its limitations (Gardner expressed a big picture limitation) but perhaps combined they can help.

53 / The blind Men and the Elephant

Perhaps the indicators project is more about helping combine the perspectives blind men in order to better understand what is going on. At this stage, just maybe the managers can get their hands on it. But not until we’ve tested the “sight” of the analytics blind man. Which leads nicely into the next section.

The patterns

Much of the initial work of the indicators project has simply been to investigate what the analytics blind man can actually see. What were the patterns in the usage data? Some of this exploration was inspired by the work of others. We were asking, “Does that same pattern hold here?”. We were particularly interested in seeing if what patterns emerged from cross-LMS, cross-institutional, and longitudinal data. Here’s a quick list of what we’ve looked at so far, more explanation following.

First, the list

  • Does LMS feature adoption change over time and between systems?
  • Is there a link between LMS activity and student grades?
  • Is there a link between LMS activity and external factors (e.g. staff participation, staf background, instructional design involvement, student age)?
  • Investigating critical success factors.
  • Differences between LMSs.

Feature adoption

An LMS comes with a host of features. Which features are used? Does feature adoption change over time? Based on the work of Malikowski et al (2006, 2007, 2008) we initially examined feature adoption within a locally grown LMS, Blackboard use at the same institution, and eventually Moodle feature adoption.

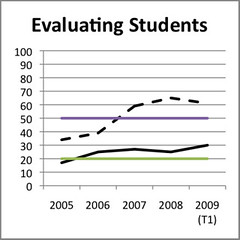
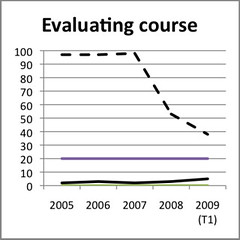
Malikowski et al identified five categories of LMS features. Our initial exploration of four predominant features at the one institution from 2005-2009 revealed some widely different results as summarised in the following graphs. Some explanation of the graphs

  • The green and purple lines represent the top and bottom ranges found by Malikowski et al.
  • The black continuous line represents feature adoption with this institution’s version of the Blackboard LMS.
  • The black dashed line represents feature adoption with a locally produced “LMS”.

Feature adoption - Transmit Content - Wf vs Bb

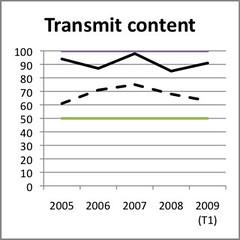
The transmit content usage for Wf (locally produced LMS) only includes optional content distribution. Wf automatically produced course websites with a range of information. Academics could optionally add more material.

Feature adoption - Class Interaction- Wf vs Bb

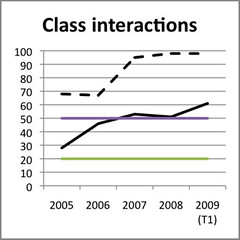
Use of class interaction features were significantly higher in Wf than Blackboard and what was found by Malikowski et al.

Feature adoption - Evaluating Students - Bb vs Wf

Feature adoption: evaluating Courses Bb versus Wf

Student activity and grades

Dawson et al (2008) found significant differences between low and high performing students in the quantity of online sessions times, total time online and the amount of active participation in discussion forums. i.e. the more usage of the LMS, the better the grade for students.

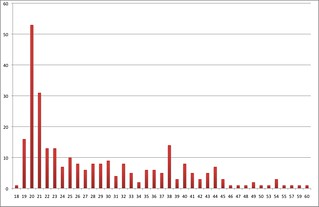
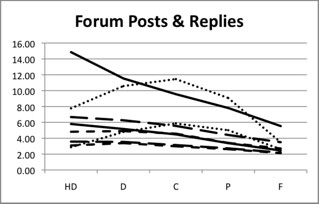
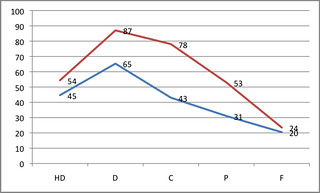
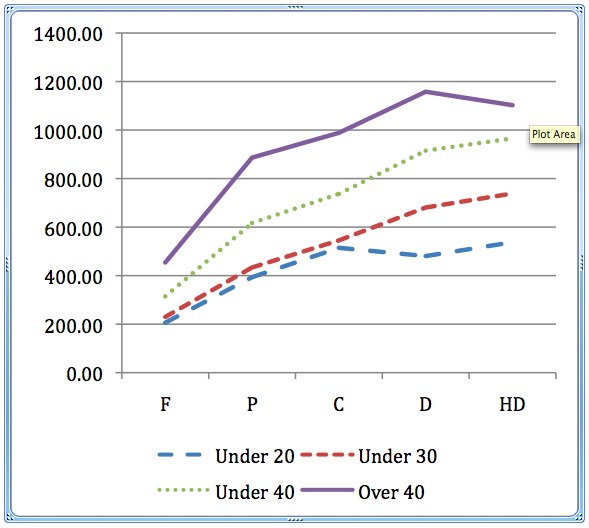
We found that this generally applied for our students whether “usage” was measured by visits to the LMS, posts to discussion forums, or replies to discussion forums. However, it didn’t apply to all groups of students. The institution had three types of students. The following graph shows how one group (the dotted line) don’t show this pattern. With this group of students, students who got high distinctions and distinctions had less LMS usage than the students with a Credit.

Staff interaction impact on forum posts and replies

Impact of external factors

We then explored whether other factors influenced this link between student usage and grade.

For example, would online courses taught by the education academics (teacher education) be any different than the other courses. The following graph shows somewhat similar trends, but it also shows that education (EDED) courses have discussion forums that are, on average, visited less than other courses.

Hits on course sites and forums

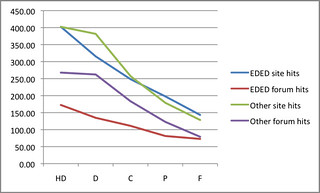
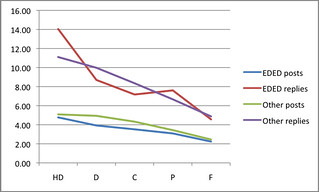
And when looking at the average number of posts/replies by students the expected pattern breaks down. Especially for replies.

Forum posts and replies

We found that staff involvement with course sites made a difference. The following graphs show the usage/grade pattern for courses where staff accessed the course website less than 100 times during the course.

Average student hits on course site/discussion forum for super low staff participation courses

Average student posts/replies on discussion forums for super low staff participation courses

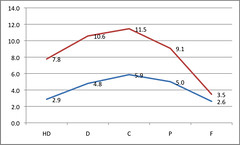
We also found that age changed the pattern and level of usage. Older students used the LMS more. Younger students less.

Critical success factors

The choice of external factors was informed by Fresen’s (2007) work, which identified a “taxonomy of factors to promote quality web-supported learning”.

Differences between LMSs

Beer et al (2010) compared various patterns between Blackboard (pre-2010) and Moodle (2009 and beyond). Findings included

  • Number of clicks on Moodle course sites somewhat lower than on Blackboard.
  • Average time on site was about the same between the two LMS.
  • The average number of pages per visit on Moodle was less than for Blackboard (11.37 versus 24.51).

References

Barneveld, A. V., Arnold, K., & Campbell, J. P. (2012). Analytics in Higher Education: Establishing a Common Language. Business (pp. 1-11). Retrieved from http://net.educause.edu/ir/library/pdf/ELI3026.pdf

Beer, C., Clark, K., & Jones, D. (2010). Indicators of engagement. Curriculum, technology and transformation for an unknown future. Proceedings of ASCILITE Sydney 2010 (pp. 75-86). Sydney. Retrieved from http://ascilite.org.au/conferences/sydney10/procs/Beer-full.pdf

Dawson, S., McWilliam, E., & Tan, J. P. L. (2008). Teaching smarter: How mining ICT data can inform and improve learning and teaching practice. Melbourne. Retrieved from http://www.ascilite.org.au/conferences/melbourne08/procs/dawson.pdf

Fresen, J. (2007). A taxonomy of factors to promote quality web-supported learning. International Journal on E-Learning, 6(3), 351-362.

Malikowski, S. (2008). Factors related to breadth of use in course management systems. Internet and Higher Education, 11(2), 81-86.

Malikowski, S., Thompson, M., & Theis, J. (2006). External factors associated with adopting a CMS in resident college courses. Internet and Higher Education, 9(3), 163-174.

Malikowski, S., Thompson, M., & Theis, J. (2007). A model for research into course management systems: bridging technology and learning theory. Journal of Educational Computing Research, 36(2), 149-173.

Explorations of narrative research

For a long time I’ve had a vague interest in narrative research, i.e. it’s one of those things I always meant to learn more about. Here are some initial explorations.

Narrative approaches to education research

My google for “narrative research method education” turns up this site from the UK as the #1 hit. I’ll start there.

Connects strongly with me from the start due to this “Human beings are storying creatures. We make sense of the world and the things that happen to us by constructing narratives to explain and interpret events both to ourselves and to other people.”

Dave Snowden often uses the label Homo Narrans as an alternate label for the species. These folks have an academic reference for something similar

Indeed, somewhat playfully, it has been suggested that there is a case for revising the term homo sapiens to ‘homo fabulans – the tellers and interpreters of narrative’ (Currie, 1998: 2).

Lots of discussion here, particular liked this

Bruner has suggested that there are two basic ways in which human beings think about, make sense of, and tell about the world: narrative cognition and logico-scientific paradigmatic cognition (Bruner, 1986). Essentially, logico-scientific cognition is concerned with universals, empiricist reasoning and proof: and narrative cognition, with how the particular and specific contribute to the whole.

Especially the last point about the “particular and specific” have contributions to make for the whole.

Richardson’s (2000) criteria for evaluating narrative papers

  • Substantive contribution.
  • Aesthetic merit.
  • Reflexivity and participatory ethics.
  • Impact.
  • Experience – near

Deluze and rhizomes get a mention for a number of things, including structure.

List of narrative approaches

  • Autoethnography.
  • Ethnographic fiction
  • Poetry.
  • Performance ethnography.
  • Mixed genres.
  • Writing as a method of inquiry.
  • Narrative interviewing.

It would appear that autoethnography is approach currently most appropriate. Resources to follow up with include

  • Sparkes A (2001) Auto-ethnography: self indulgence or something more In: Bochner A and Ellis C (eds) Ethnographically Speaking Alta Mira Press CA
  • Bochner A (2000) Criteria Against Ourselves Qualitative Inquiry, Volume 6 Number 2, pp.266 – 272
  • Denzin, N. (2003) Performing (Auto)Ethnography: The Politics and Pedagogy of Culture (Thousand Oaks, Sage).
  • Ellis C and Bochner A (2000) Auto Ethnography, Personal Narrative, Reflexivity: Researcher As Subject, In Denzin N and Lincoln Y (eds) (2nd Ed) Handbook of Qualitative Research Sage Thousand Oaks
  • Etherington, K. (2004). Becoming a reflexive researcher. London: Jessica Kingsley

Autoethnography

So let’s explore this little thread a bit. Wikipedia is about as good a place as any to start.

Apparently I’m leaning towards analytic authoethnography, rather than evocative authoethnography, as per Ellingson and Ellis (2008, p 445) – as quoted on Wikipedia

Analytic autoethnographers focus on developing theoretical explanations of broader social phenomena, whereas evocative autoethnographers focus on narrative presentations that open up conversations and evoke emotional responses.

But perhaps not, in some other literature there appears to be some disquiet about the rationale of analytics autoethnography.

This captures an aspect/perspective interesting to me (again from Wikipedia)

According to Bochner and Ellis (2006), an autoethnographer is “first and foremost a communicator and a storyteller.” In other words, autoethnography “depicts people struggling to overcome adversity” and shows “people in the process of figuring out what to do, how to live, and the meaning of their struggles” (p. 111).

More resources

  • 35(4), August 2006 of the Journal of Contemporary Ethnography
  • 13(3), Summer 2007 of Culture and Organization
  • Humphreys, M. (2005). Getting Personal: Reflexivity and Autoethnograhic Vignettes, Qualitative Inquiry, 11, 840-860
  • Ellingson, Laura. L., & Ellis, Carolyn. (2008). Autoethnography as constructionist project. In J. A. Holstein & J. F. Gubrium (Eds.), Handbook of constructionist research (pp. 445-466). New York: Guilford Press.
  • Maréchal, G. (2010). Autoethnography. In A. J. Mills, G. Durepos & E. Wiebe (Eds.), Encyclopedia of case study research (Vol. 2, pp. 43–45). Thousand Oaks, CA: Sage Publications.

"Here I stand" – Campbell's concerns on analytics and other stuff

Continuing a re-engagement with analytics I spent some time listening to Gardner Campbell’s talk to the LAK’12 MOOC – Here I Stand and from there followed various links.

Gardner captures one of my major concerns with how analytics may proceed, especially within institutions that are increasingly driven by accountability, efficiency and other concerns. Concerns that they are responding to with top-down management. Gardner’s uses the metaphor of the human mind/learning being as complex as M-Theory (actually more complex) and that learning analytics as commonly thought of is equivalent to measuring M-Theory using a simple cartesian graph.

The end result is that it simplifies learning and how we treat to an extent that is meaningless.

He connects this view of analytics with the LMS approach to e-learning and the traditional nature of curriculum that are all in the simple domain. Learning analytics just continues this. Lots of imagery with school as a feedlot or a Skinner box.

Wikipedia image of Skinner box

Gardner talks about four strong cautions for analytics
Four strong cautions

  1. “Student success”
    Typically defined within analytics as the student passing doesn’t mean the same as succeeding in life. e.g. given of high performing high school student with no idea of what to do next.
  2. Complexity
    A lot on this that resonates, more below.
  3. Points of “Intervention”
    Just one idea is that of an analytics system that, rather than intervening just before the student fails (as most current analytics projects are trying to achieve), intervenes just as the students begins to understand.
  4. The “Third wave”

Draws on John Naughton – From Gutenberg to Zuckerberg: What you really need to know about the Internet (2012) – to illustrate “Complexity is the new Reality”

  1. Non-linear
  2. Feedback matters – a lot
  3. Systems demonstrate self-organisation
  4. EMERGENCE – synergies – new phenomena

Naughton also talks about double loop learning where “success means more than positive outcomes “relative to pre-established targets” – Which sounds very much like learning objectives – Instead it means that learners “need to reflect on the appropriateness, in the light of unfolding events, of the assumptions (the mental model) used to set up those actions and targets”

Gardner’s quote (or close to it somewhere in here) is “A real learning analytics system must be able to learn.”

Also mention of the Pardox of the Active User

Other links

Shelia MacNeil offers another summary of Gardner’s talk and points to other work. It was from Shelia’s post that I came across Exploiting activity data in the academic environment which is a somewhat broader example of analytics including some useful insights into privacy etc issues around the data.

Shelia identifies some very useful questions

What are the really useful “analytics” which can help me as a learner, teacher, administrator, etc? Which systems provide that data just now ? How can/do these stakeholders access and share the data in meaningful ways? How can we improve and build on these systems in ways which take into account the complexity of learning? Or as Gardner said, how can we start framing systems and questions around wisdom?

An earlier blog post from Gardner that arose out of reading this book (really learning to dislike book’s that aren’t available on Kindle).

Implications for the indicators project

The types of questions identified are exactly the areas which the Indicators Project was (and is about to start again) attempting to explore. The point about complexity is also timely, as that is the perspective that will underpin our work. Consequently I will be reading a bit more of Naughton.

I especially like the point about double loop learning. For three main reasons

  1. It captures one important distinction between traditional business intelligence approaches and what we hope to do with the indicators project.
  2. It highlights how we’d like to use analytics, i.e. to help university academics engage in double loop learning about how and why they teach.
  3. It frames a concern I have out the outcomes focus of much university education, i.e. we’re measuring students against outcomes we think are important and we’ve established ahead of time, rather than asking them to reflect on their assumptions and mindsets.
    In particular, I’m thinking this might be an interesting point of departure for thinking about how courses I’m responsible for might evolve.

Learning analytics and study behaviour: A pilot study

It looks like we’re going to start playing around with the Indicators project again. So it’s time to start reading up a bit on the learning analytics literature and see where the interesting work is. First up is

Phillips, R., Maor, D., Cumming-Potvin, W., Roberts, P., Herrington, J., Preston, G., Moore, E., et al. (2011). Learning analytics and study behaviour: A pilot study. In G. Williams, P. Statham, N. Brown, & B. Cleland (Eds.), ASCILITE 2011 (pp. 997-1007). Hobart, Tasmania.

The following is a summary/reflection of reading through it.

Abstract

Describes a study that looks closely at analytics data of four students – interacting mainly (it appears) with lecture capture software and then interviewed them to find check out the assumptions from analytics. It found that the analytics had some limitations which was supplemented nicely by the qualitative data. Makes some suggestions for further research around the methodology.

Aim is to find out how students engage with and study in e-learning environments. But this study focuses on the lecture capture tool

Background/intro

Makes mention of “Much e-learning research over the years has been based on quantitative data largely derived from the perceptions of students” which has some limitations. Other work is qualitative around individual contexts. This work is seeking to combine descriptive/qualitative with learning analytics.

Analytics has a history, but the meaning of the data is not always clear. usage logs record behaviour, without explaining why suggesting taking care to analyse and interpret the data.

Prior work

Some mention of the lecture capture work. Which is seen to focus on the technology, not the learning environment as a whole.

This was the impetus for our current work, which holistically examines a unit of study, and uses learning analytics to gain a richer understanding of what students actually do in a technology-enhanced learning environment.

The focus being on learning processes used by students, rather than learning outcomes.

Lectopia usage patterns

Summarises prior work around analytics from lecture capture system and identifying “types” of student users: conscientious, good-intentioned, repetant, bingers, crammers, one-hit wonders, and random users.

This work reports on a pilot study interviewing students with diverse usage patterns to find out what’s going on.

Method

..pragmatic, mixed-methods paradigm of inquiry using a modified design-based research approach..

Data sources: their analysis tool, SNAPP, standard LMS usage reports, assessment results, attendance logs for lectures, interviews with teachers, and semi-structured interviews with students.

Received ethics approval for an approach that included identifying students and handling this appropriately. Some difficulties getting a good sample of students to interview – became a “convenience sample”

Students drawn from a 3rd year sociology of education course. ~150 students on main campus, ~50 students on regional campus, ~100 DE students. 1 hour lecture and 2 hour workshop for internals. Lectopia plus discussion forum activities for DEs. Numerous readings.

109 students accessed lecture recordings

Recording usage appears to match the expected peaks (lead up to assessment) and troughs (other times).

Interviewed students were all internal.

Discussion

Interview data from 4 students is summarised. And shows very different approaches to study.

the four cases reported here start to illustrate some of the complexity of the modern, technologyenhanced learning environment.

A range of limitations of the study are identified and then

two major implications arose from this analysis: a need for the broadening of the mechanisms for identifying student behaviour patterns; and the application of the methodology to other contexts.

Student don’t visit the lecture capture system enough to give useful data. Broader LMS usage needs to be examined.

Suggests the addition of a mid-term survey of students about their perceptions of technology use and wider range of data.

Talks about selecting more units to include by reviewing courses for alignment.

My on-going concerns with ePortfolios

I was asked to respond to a set of questions around ePortfolios. The questions arose from some earlier posts: Why am I an ePortfolio skeptic and Portfolios often implemented badly. What follows are my responses.

These comments are made in the general context of Australian higher education and with the assumption that “ePortfolio” generally means the implementation of an institutional system, often using something like Mahara.

A few years ago, you were critical of eportfolios as something that took time and effort away from more pressing goals. What are your thoughts on eportfolios today? If they’ve changed, explain what motivated those changes.

Generally my criticisms of ePortfolios within higher education haven’t changed. My criticisms were made in the context of the Australian higher education sector – which is where all my experience has been – however, I do believe there’s a strong possibility that they apply to higher education in other countries.

My problems weren’t so much with ePortfolios, but instead with how higher education institutions deal with learning and teaching, especially around innovations being driven by information technology. These are long term problems. Some of my qualms connect with the concerns expressed by William Geoghegan (1994) almost 20 years ago.

They also connect with the comments of National Research Council when they suggest that portfolio assessments “are often implemented poorly” (p. 142)

And that’s before the question of information technology enters the picture.

My main criticism is that ePortfolios – especially the particularly the implementation of the particular ePortfolio system selected by a university – becomes the proxy purpose. i.e. rather than goal being to improve the quality of learning and teaching, the goal becomes successful implementation of the ePortfolio system on the assumption that by doing so the quality of learning and teaching will be improved.

I don’t believe that happens in most cases.

A goal of eportfolios is to lead students to make connections between their work in several different courses and helping them to learn more about themselves as they prepare to enter the workforce. Is that a realistic expectation? If not, what benefits might you expect to see?

Given the nature of most

  • students;
    Pragmatically focused on getting the grade they desire.
  • academic staff; and
    Pragmatically focused on their particular course, while at the same time trying to engage in research is what they get promoted for.
  • academic programs.
    Created using top-down composition so that most courses are stand-alone silos with only limited connections at the start/end of courses (i.e. pre-requisites)

It’s very hard to encourage those connections between courses to be made.

Especially when introducing a new technology – the ePortfolio system – as the means to achieve this cultural shift.

Haseltine (2010) uses the CIA as an example of what happens in these types of situations

..when agencies spent money on new systems, they expected to get a return on their investment and therefore tried to force employees to use the new technology. Usually such mandates failed for one of two reasons. Either employees simply refused to do as ordered, or they followed orders but used the new technology exactly as if it were the older technology it replaced, and never changed their work habits or business processes.

This sums up nicely the experience with most universities with enterprise LMS and the roll-out of enterprise ePortfolio systems is facing the same problems.

Over time, there are always some exceptions.

But time is not something institutional ePortfolios have. They are being overtaken by the rise of growing abundance of information technology
services within the cloud.

From one perspective, ePortfolios are a personal tool. It’s for the student to use for their own learning, for developing their own professional portfolio. Why then are Universities mandating them?

Arguably it is because we’re in a transition phase from when Universities had to provide these services to a time when they will provide their own. I would suggest that Universities providing institutional ePortfolio systems are in danger of preparing themselves and their students for yesterday, rather than preparing for tomorrow.

Gardner Campbell argues for this type of shift in his “A Personal Cyberinfrastructure”.

More concrete problems with the institutional ePortfolio systems include student institutional mobility and the comparatively poor quality of the tools.

Last year I was a student at one University. This year I am an academic at another University. I now have two Mahara-based ePortfolios, one for each institution. Sure, I can export the information from one and import it into another, but why should I have to do extra work simply because I’ve moved from one institution to another? In addition, my student portfolio is being used as an exemplar at that institution, so I can’t really remove it now that I’ve moved on.

As it happens, I have had a blog for quite sometime. It’s my real ePortfolio. The blog is hosted on WordPress.com. Apart from the folk working for WordPress, WordPress has a huge additional ecosystem of developers and designers around it. Much larger than any open source or commercial ePortfolio system is ever going to have. As a result, the quality of the WordPress services and tools is significantly better.

So, as a student I’m being

  1. forced to use a tool that is more difficult to use than a tool I already use;
  2. to duplicate something I can already do;
  3. in a way that is heavily dependent on the existing institution;
  4. because the institution says I should.

In what circumstances, if any, could eportfolios be used effectively? I’m not sure what is currently meant by eportfolios can be used effectively at an enterprise, or even program level.

I’m sure there are individual courses that are making effective use ePortfolios. Mostly because the tool matches the culture created by the academic staff within the course.

There may even be some programs that do this. I would imagine they would be disciplines where the nature of an ePortfolio matches the long-standing disciplinary culture.

But even then, you have problems with the growing comparative limitations of the tools and the question of why an ePortfolio tool should be provided by an institution.

However, without an appropriate culture……

Do you have any personal experience with eportfolios? If so, please share.

Last year, I completed a graduate entry pre-service teacher program. As part of that program we were required to create an ePortfolio for the local teacher registration body.

This year, I’m teaching an ICTs and Pedagogy course to third year Bachelor of Education students. The course requires students to use
their Mahara portfolio to submit assessment as part of a broader push to encourage familiarity with the tool.

I have almost 10 years of developing e-learning innovations for university education, and almost another 10 years encouraging and enabling other academics to adopt e-learning innovations.

What should colleges be aware of before assigning eportfolios?

Does it fit the culture and practice of the academics or other members discipline? Is maintaining an eportfolio something that is accepted within the discipline? Can the students see existing professionals engaged in maintaining an ePortfolio?

The literature around portfolio assessment and its likely limitations due to poor limitation.

The rise of cloud services, social media and the idea of a personal cyberinfrastructure and whether it makes more sense to engage out there, rather than provide an institutional system.

The apparent exponential growth of Information Technology which suggests if the technology isn’t ready now for this idea, it will be very soon.

References

Geoghegan, W. (1994). Whatever happened to instructional technology? In S. Bapna, A. Emdad, & J. Zaveri (Eds.), (pp. 438-447). Baltimore, MD: IBM. Retrieved from http://eprints.ecs.soton.ac.uk/10144/

Haseltine, E. (2010). Long fuse, big bang. New York, New York: Hyperion books.

Eduhacking – a better use for (part of) academic conferences?

In short, can we get an Eduhack style event running at ASCILITE’12? Want to help? If you want, skip to the point


Possibly the most productive conference I’ve ever been on was the 1996 ITiCSE Conference in Barcelona. (It seems the conferences have evolved from “Integrating Technology into CS Education” to “Innovation and Technology in CS Education”). Apart from my first trip to Spain, the conference introduced me to something different in terms of conferences, the working groups.

We were the first set of working groups and at that stage it worked a bit like this:

  • Someone came up with a topic – in our case “World Wide Web as an Interactive Teaching Resource”.
  • They called for participants.
  • We started collaborating ahead of the conference.
  • During the conference we (based on my vague recollection of 16 years ago)
    • Worked for a day or two before the conference proper started.
    • Did some work during the conference, including presenting a “poster” on our current progress. (apparently shown in the image below)
    • Did some final work at the end/after of the conference.
  • Produces a final document

Poster of working group

The benefit

The biggest benefit that flowed from that event was meeting the co-author of the book we wrote, which (even with its limitations) remains the most cited of my publications. Without being a member of the working group with my co-author, the book would never have been written.

Having to work with folk at a conference on a specific project, rather than sit and listen or sit and drink network, provides additional insights and connections. It can also be a bit more challenging, but nothing in life is free.

The wasted opportunity

This type of approach seems to address the wasted opportunity that is most conferences. You have all these talented, diverse and skilled folk in the one location, but limit their interaction to presentations, panels and socialising. Nothing, at least in my experience, works to bring those diverse perspectives together to produce something.

For a long time, I’ve been wondering if something different is possible.

Looking for alternatives

The ITiCSE working group approach was okay, but fairly traditional. It aimed to produce an academic paper. I was involved with the first one, it would be interesting to see how they’ve evolved and changed based on the experience.

The REACT project tried to ensure that planned innovations in L&T benefited from diverse perspectives before implementation. But like the working group idea used an academic paper as the main artifact. REACT never really went anywhere.

And then there is Eduhacking in the style used by @sthcrft and @stuffy65 at UNE and in particular @sthcrft ‘s call

do we need a cross-institution eduhack event? From my point of view, anything that’s about collaborating on ideas and possibilities has got to be better than yet another show and tell event. Who’s in?

I’m thinking: Yes and me. The question is where to now?

How might it work?

Education Hack Day describes the aim this way

The mission was simple: listen to problems sourced by teachers from around the world, pick a dozen or so to tackle, and form teams around those problems that would each come up with and execute a creative solution to solve them.

This seems to have been based on the older/broader idea of from the developer world of a hackathon. As with the UNE experiment, the focus here wouldn’t necessarily be on software developers, but a broader cross-section of people.

So a process might be:

  • Pick a conference, one that has a good cross section of educational technology type folk.
    For example, ASCILITE’12.
  • Run an Eduhack day just before the conference proper starts, probably as a workshop.
  • Actively encourage a diverse collection of folk to come along.
  • Distribute a call for problems prior to the conference.
  • Ensure that the setting for the Eduhack is appropriate (i.e. not the normal conference breakout room).
  • Have a loose process to select the problems to be worked on and let folk go.
  • Have some of the outcomes presented as posters during the conference.
  • Encourage/enable groups to keep working on the problems post-conference, perhaps for presentation as traditional papers at the next conference?

I’m sure there are improvements to be made. Who’s interested?

Some challenges for #pstn

The #pstn project (#pstn – Pre-service Teacher Networking) is probably the most interesting project I’ve currently involved with (and one of many being starved of time as I get my head around a new institution). The project has a great team and is seeking to address a real problem – improving the transition of pre-service teachers into the profession and consequently retaining more of them – with an approach (social media, bottom up, emergent, connections, authentic practice etc.) that resonates strongly with my beliefs.

Now that I’m at the end of the 2nd week of teaching, I have a slightly better feel for the students I’m teaching and the students who I think can benefit most from #pstn. That growing familiarity is suggesting some challenges for #pstn. The following shares these challenges and some thinking about them. Of course, this is all based on my own ad hoc experience and filtered through my own prejudices.

The 5 challenges

I can currently see five challenges:

  1. Facebook inertia.
    Almost all of them – especially those in the early 20s – are Facebook users, not Twitter.
    This means they have a preference for one social media tool, but it also means they have an existing network and set of practices with that tool. I wonder if they have the room to allow Twitter and its different set of practices into their everyday practice? I also wonder if they can handle another different network of connections that is more professionally focused?

    Is there work that’s been done about whether people can easily support both? Or what it takes for people to shift from one to the other? Most of the people I know are either Twitter or Facebook users. Is that common?

  2. Difficult of paying attention to long-term problems.
    Not sure the students have really internalised that problem of up to 50% of the teaching profession leaving within 5 years as a big problem for them. Especially now, in the 3rd year of their degree. They are focused on more immediate problems and tasks.
  3. Pragmatism.
    While there are always exceptions, the majority of the students appear fairly pragmatic and focused on doing what they need to do to pass the courses. In some cases, they are simply very busy with work, families and studies. Adding something like #pstn will be difficult.
  4. The current culture they are swimming in.
    Something like #pstn is essentially invisible to non-existent within the courses they are taking. The traditional approach to education doesn’t encourage this sort of practice. In fact there are a range of minor barriers even for my participation. But for the students, not seeing this modelled in their courses (combined with their pragmatism) means I doubt many will engage.
  5. No answers yet, just identifying some challenges.

And it's back to a lecture

For a variety of reasons I returned to giving a lecture today. Here’s a quick reflection and thoughts where I might go next.

Why?

As originally explained here I wanted to move away from the idea of a lecture. And I have implemented the ramble idea and used it as a basis for lectures/tutorials last week.

However, the pull of the lecture is great. So, I gave into temptation and gave a lecture. Sitting here now, I am wondering why I did this to myself and the students. The first part of the lecture was your typical diatribe and done badly. Little or no engagement from the students and achieved little more than consuming some time.

I did get to use the lecture capture facility on-campus, which seemed to work okay. Of course, given the latter part of the lecture was focused on students doing individual or group work, I’m not sure the recording approach works well. I probably should cut bits out of the video. Though it does appear that the quality of the recording is quite low.

As to deciding what I’ll do next week, am going to wait for feedback from students, but current preference would be not to record a lecture like this again, focus on students doing activities based on the ramble.

Especially when some of the activities done in the subsequent tutorial generated much more engagement and took things in really interesting ways.

The lecture

There are some slides and some video

Implementing a course barometer in Moodle: A kludge

It’s the start of the second week of the course I’m teaching. I’m directly responsible for 60 odd on-campus students and 130 or so online/distance students. That split reminds me a lot of my teaching at CQU in the mid-1990s. The deja vu continues in terms of getting a feel for how the students are going, how are they responding to the course, its model and content? Back at CQU the solution was inspired by course barometer idea from some University folk in Sweeden.

The original course barometer was a purpose-built application in Webfuse, an “LMS” used at CQU from 1996 through 2009. This post records an initial attempt to recreate something simliar using standard Moodle 1.9 modules.

What?

The barometer is meant to be a simple form that allows the students to

  • Indicate whether how they are feeling about the course at the moment: good, bad, or indifferent.
  • Provide some free-text comments to supplement the feeling.

Preferably this is done anonymously – previous research has shown that anonymity isn’t as important as doing something with the feedback – and would allow us to break up the students by campus/mode of study.

Some form of report should be generated to allow teaching staff to analyse student responses. One the nice list is a method for staff to respond.

How?

Thanks to @markdrechsler and @mguhlin the Moodle tool possibilities (with links to Moodle 2.2 docs) are :

  • Choice,
    Appears that the choice module is limited to MCQs, but I do want the free text response.
  • Feedback,
    Looks like this could be the one.
  • Questionnaire (though apparently deprecated), and
    Doesn’t appear to be included in the USQ Moodle instance.
  • my original idea Quiz.
    As Mark suggested, having the concept of a “right” answer built into the quiz means it’s not great for the purpose of a barometer.

Place with feedback

Time to get familiar with what the Feedback module can do. Add a new Feedback activity and the form provides (which seem the same as those documented here)

  • Name and description.
  • Timed release of the activity.
  • An anonymous option – FTW.
  • Allow the students to see the analysis.
    There are two sides to this. Yes is good, allows students to get a sense for how others are going. No it is bad, because of the possibility of “bad” responses. I’ll go with yes.
  • Email notification of submissions.
    Will turn this one, will help mitigate the risk of “bad” responses.
  • Multiple submit – no.
  • It does allow separate groups.
    Wondering if this will provide the separation of students into the different modes.

Creating it’s a fairly simple process. Add the questions. Create a template (allow use of these same questions in other feedback activities). Away we go.

I do wonder if USQ automatically create student groups based on mode of study? And yes they do. And the Feedback module allows separation of students into groups.

Done

Fairly simple to set up and even before I’d formally announced it, one student has submitted their first bit of feedback.

Gilstrap, Martin and the definition of a lecture

A couple of weeks ago, I was reflecting on something written about lectures when I paraphrased a definition/description of the lecture. I paraphrased it as

A method for transferring the content of the lecturer’s paper to the paper of the students without it passing through the minds of either.

I’d forgotten the exact quote and certainly never had a reference.

In comments on that post, Ian Reid shared the following version and reference

“A lecture is a process in which information passes from the notes of the lecturer into the notes of the student without passing through the minds of either.” (Gilstrap & Martin, 1975)

Peter Albion shared his experience of first hearing this definition in the late 1960s.

So, the question was where did this definition/quote originate?

Gilstrap and Martin

As it happens, Amazon had used copies of Gilstrap and Martin (1975) going cheap, so I ordered one. The intent being to trace the quote back a bit further. Here’s what I found (Gilstrap and Martin, 1975, p. 7)

As has been said, the words of the teacher quite often do go into the notes of the student without passing through the minds of either.

Not exactly definitive.

An earlier source

Searching a bit further brings up this blog post which mentions Eric Mazur mentioning a similar quote (Mazur, 2009, p.??)

I once heard somebody describe the lecture method as a process whereby the lecture notes of the instructor get transferred to the notebooks of the students without passing through the brains of either (3).

Where the reference to 3 is actually Huff (1954). That’s going back a bit further. As it happens there is a scanned version of Huff (1954) available online. With this version and the OCR abilities of Adobe Acrobat I can do a search of that book to reveal (Huff, 1954, p. 47)

It is all too reminiscent of an old definition of the lecture method of classroom instruction: a process by which the contents of the textbook of the instructor are transferred to the notebook of the student without passing through the heads of either party.

The context of this quote is in the examination of a number of flaws about how various findings are reported. In particular, how some phrases are taken uncritically. They aren’t picked apart further to determine what is said, or not said. The example to which the lecture quote is compared is a sentence from a magazine report

a new cold temper bath which triples the hardness of steel, from Westinghouse

Huff asks what exactly does this statement mean? Does any kind of steel become three times as hard once put through this bath? Or does the bath produce a particular type of steel that is three times as hard as any previous steel?

The quote has passed from the publicity release of Westinghouse and into the paper without it troubling the reporter’s mind.

The original source?

So, is this the original source of this quote. It looks like a good candidate. 1954 is fairly early and I’ve sighted the book.

But then there are other attributions such as this (and others) which ascribe the comment to R.K. Rathbun. Interestingly, I’m having trouble identifying Rathbun via Google. Am I showing my ignorance? Anyone help address my ignorance?

References

Gilstrap, R. L., & Martin, Wi. R. (1975). Current strategies for teachers: A resource for personalizing instruction. Pacific Palisades, CA: Goodyear Publishing Company.

Huff, D. (1954). How to lie with statistics. New York, NY: W. W. Norton.

Mazur, E. (2009). Farewell, Lecture? Science, 323(5910), 50-51.

Moodle, blogs, feeds and the Google feed API

Time to tweak the course site again. I attempting to encourage the students to engage with technology, to become digital residents. The assumption is that they will really only be able to design great teaching with ICTs, if the use of ICTs is part of their everyday life. One aspect I’m attempting to encourage is blogging.

To make the blogging process a bit more obvious, I wanted to include some aggregated view of the students’ blogs on the course site to increase the visibility and hopefully the prevalence of blogging. Here’s how I did it with the Google feed API.

What does it look like?

The following image (click on it to see a bigger version) shows what the site looks like now. The new bit is labelled EDC3100 blogs. Every five seconds the link (e.g. “My Animoto video”) scrolls onto the next one. The links are chosen from the 8 most recent blog posts aggregated by this Yahoo pipe.

If you move the mouse over the scrolling blog links, the scrolling pauses. Click on the blog title and you will be taken to the original blog.

3100 page with feed added

How does it work?

The process goes something like this

  1. I created this Yahoo pipe to aggregate the feeds.
    Currently the pipe is hard-coded with the feeds of the student blogs. In the future I need to connect this with diigo bookmarks the student blogs so I (or anyone in the group) can add their blog.
  2. Eventually found this explanation of Google’s feed API.
    It transforms the RSS feed into some nice HTML that can be placed on a web page.
  3. Stuck an iframe in a Moodle label.
    It appears that Google feed API wants to change the head of the HTML, something you can’t easily do in Moodle. So I had to upload a separate web page onto the Moodle service and then use an iframe to include it on the site page.

Reflections and work to do

Time to stop playing with the tech and design some prompts to encourage the students to participate.

Should probably look at putting a “help” or “about” link near the object so students can scratch their itch about what it is.

Need to get the Yahoo pipe interacting with the Diigo group bookmarks.

This was a useful respite from some other work, but in the end the technical aspect won’t be enough with additional work. The work around with the iframe was a bit kludgy. Including the object at the top of the page, does increase scrolling. So I wonder about the value.

I’m also wondering how much of this should be talked about with the students? If feel that an understanding that this form of manipulation of existing systems is important to teachers if they are looking to integrate ICTs into teaching. A bit of the whole Rushkoff, Program or be Programmed ethos.

Powered by WordPress & Theme by Anders Norén

css.php