Assembling the heterogeneous elements for (digital) learning

Tag: mav

Exploring course site resource usage using MAV

The following starts with the following question raised from a colleague about a Moodle course site they have designed.

https://twitter.com/chalkhands/status/823750342999306240

The tabs mentioned in the above aren’t standard to Moodle. They are an institutional addition and a follow up tweet illustrates

https://twitter.com/chalkhands/status/823751353155534850

The tabs have been added (I believe) as they capture important information that students should be able to find easily on every course site from this institution. The consistency == quality argument of which I’m not a fan.

The actual problem @chalkhands is having arises from a number of clashing perspectives/models for creating a Moodle course site. The following is not going to tackle that issue. Instead, this discussion has sparked an interest in exploring just how important those tabs and the information held there is to students. Or more correctly, how much have they been used in the courses I have been responsible for (and can I find out).

You can’t find out?

The “institutional tabs” are supported by some local additions to Moodle that provide the functionality. It appears that the usage of some of these tabs can’t be tracked by the standard Moodle logs. In particular, it appears that the Assessment, Study Schedule, and Teaching Team can’t be tracked on a standard site. At least can’t seem to find how to find this information via the Moodle logs report.

The benefits of hacking (this time)

In this particular case, it’s lucky that I have been guilty of “hacking” the site. Instead of the institutional specific method for these particular tabs they are pointing to more traditional Moodle plugins, which play with the Moodle logging facility. In turn, this allows me to use the Moodle Activity Viewer (MAV) script to find out how these things are being used.

For example, I can explore usage of the Assessment, Study Schedule and Teaching Team tabs by students in the S1, 2016 of the 300+ undergrad course I taught.

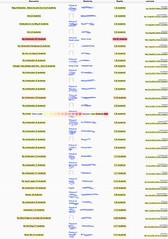
I can see how many times they clicked on the resources. (Click on the images to see larger versions)

EDC3100 2016, S1, Clicks

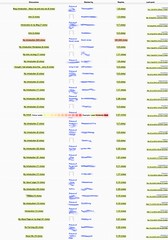
I can see the number of students who clicked on the resources

EDC3100 2016, S1, Students

Unsurprisingly, the Assessment tab was the most used. The following table summarises.

Resource Students Clicks Clicks/Student
Assessment 308 27,976 90.8
Study Schedule 274 2988 10.9
Teaching team 190 1061 5.6

What is surprising is just how much the Assessment tab is used. In theory, students can print/download a copy of this information. In spite of that, students are averaging around 91 clicks on that information during a semester.

I wonder why? Could they not figure out how to print the information? Was the printed version of insufficient quality?

Given that just under 50% of students never clicked on the teaching team information, I wonder what that says about the value of the tab? Or how it compares with other courses?

What parts of the assessment information was useful?

Using a standard Moodle plugin and combining that with MAV allows me to quickly get an indication of just which parts of the Assessment information was being used. The assessment information was implemented using the Moodle Book module, which produces a table of contents. The following images show the MAV modified table of contents for the Assessment book from the same offering.

Number of clicks on each section.

Screen Shot 2017-01-25 at 1.11.05 pm

Number of students using each section.

EDC3100 Assessment contents by student

The most clicked on information in this book are the three pages specifying what the students had to do for the three assignments. The next closest was the “learning journal” information which outlines one of the different practices in the course. The nature of which causes some consternation early in the course. But even with that, a good 10% of students never visit that information.

Also a bit interesting, less than half the enrolled students ever visit the information about how to query the marking of their assignments.

Does GPA make any difference to #moodle course usage?

Summary

In short, there is definitely a pattern. In fact, there are two patterns evident:

  1. Students in higher GPA groups click on a range of different activities and resources at much higher rates than those in lower GPA groups.
  2. A greater percentage of students in higher GPA groups will click on resources.

There are a few exceptions to this. Another less explored pattern is a drop off in usage as the semester progresses.

This is in the context of a single offering of a course I teach with all students (n=~100) enrolled as online students.

The pattern seems to exist across different types of resources from across the semester. Though there does appear to be a drop off toward the end of semester.

This aligns with findings from prior work such as Dawson et al (2008) and Beer et al (2009).

My next step is to see what reaction presenting this pattern to the next crop of students will have.

Origins

In just over a week a new semester starts. Institutional requirements mean that course sites need to be available 2 weeks prior to the start of semester. Consequently there’s already been some activity on the new site for the course I teach. In response, I observed

To which @s_palm replied

Which got me wondering. Is there a link between accessing the course site and GPA? Do “good” students use the LMS more? What happens if students are aware of this pattern?

With the Moodle Activity Viewer installed, I have one way to explore the usage question for a past course site. To be clear

  1. This is just an initial look to see if there are any obvious patterns.
  2. As @s_palm has pointed out

To test this, I’m going to

  1. Create some new groups on my old Moodle course site based on student GPA.

    I could also do this based on the final grade in this course, might be an interesting comparison.

    Glad I had access to the database, creating these groups through the Moodle interface would have been painful.

  2. I can then use MAV’s “select a group” feature to view how they’ve accessed the course site.

    MAV will show the number of clicks or number of students who have visited every link on a Moodle course site. I don’t expect the number of students to reveal too much – at least not on the home page – as completing activities/resources is part of the assessment. Comparing the number of links is not going to be straight forward given the different numbers in each group (and MAV not offering anyway to normalise this).

Explanation of the “analysis”

The quick and dirty comparison is between the following groups

  • 6 GPA (n=11) – all students with a GPA of 6 or above.
  • 5 GPA (n=49) – all students with a GPA of above 5, but less than 6.
  • 4 GPA (n=35) – GPA above 4, but less than 5.
  • Less than 4 GPA (n=28) – the remaining students, apart from a handful with a GPA of 0 (exemptions?)

The analysis will compare two usage “indicators” for a range of course resources/activities.

The “indicators” being compared are

  • Clicks / Students – the total number of clicks on the resource/activity by all students in a group divided by the number of students in the group.
  • Percentage – the percentage of students in that group who clicked on the activity/resource.

Assessment and Study Schedule

The first resources compared are

  • Assessment – a Moodle book that contains all details of the assessment for the course.
  • Study Schedule – a page that gives an overall picture of the schedule of the course with links to each week’s block.
Group Clicks / Student % Students
Study Schedule
6 GPA 4.2 100.0
5 GPA 2.9 75.5
4 GPA 2.8 74.3
Less than 4 1.3 53.6
Assessment
6 GPA 22.7 100.0
5 GPA 12.2 75.5
4 GPA 11.0 74.3
Less than 4 8.2 64.3

The pattern is established early. The higher GPA groups access these resources more.

Unsurprisingly, the assessment information is used more than the study schedule.

Forums

Next comparison is two forums. Each assignment has it’s own forum. There is a general discussion forum. Finally, there are a range of forums used for specific learning activities during the semester. The two forums being compared here are

  • Q&A forum – is a forum for general questions and discussion.
  • Assignment 3 and Professional Experience Forum – assignment 3 is wrapped around the students’ 3 weeks practical teaching period.
Group Clicks / Student % Students
Q&A Forum
6 GPA 19.3 90.9
5 GPA 7.9 65.3
4 GPA 7.3 54.3
Less than 4 1.6 35.7
A3 and PE forum
6 GPA 16.0 100.0
5 GPA 8.4 73.5

4 GPA 5.5 68.6
Less than 4 1.2 35.7

The pattern continues. Particularly troubling is the significant reduction in use of the forums by the “Less than 4 GPA” group. Only about a third of them use the forums as opposed to over half accessing the study schedule and even more accessing the assessment.

I wonder how much of this percentage difference is due to students who have dropped out early?

Week 1 activities

In week 1 of the semester the students have to undertake a range of activities including the three compared here

  • Register their blog – they are required to create and use a personal blog throughout the semester. This activity has them register and be able to view the registered blogs of other students.
  • Share introductions – post an introduction of themselves and look at others. An activity that has been recently revisited for the coming semester.
  • PKM and reflection – a Moodle book introducing Personal Knowledge Management and reflection through a range of external resources. These two processes are positioned as key to the students’ learning in the course.
Group Clicks / Student % Students
Register your blog
6 GPA 12.9 100.0
5 GPA 9.2 75.5
4 GPA 10.8 77.1
Less than 4 6.6 60.7

Share introductions forum
6 GPA 6.6 100.0
5 GPA 4.6 75.5
4 GPA 5.6 77.1
Less than 4 2.2 57.1

PKM and reflection
6 GPA 3.8 100.0
5 GPA 2.3 75.5
4 GPA 2.1 74.3
Less than 4 1.4 53.6

Generally the pattern continues. The “4 GPA” group bucks this trend with the “Register your blog” activity. This generates at least two questions

  • Are the increased clicks / students due to troubles understanding the requirements?
  • Or is it due to wanting to explore the blogs of others?

Given that the percentage of students in the “4 GPA” group also bucks the trend, it might be the former.

Late semester resources

Finally, three resources from much later in the semester to explore how folk are keeping up. The three resources are

  • Overview and expectations – a Moodle book outlining what is expected of the students when they head out on their Professional Experience. There is still four weeks of theory left in the course, followed by 3 weeks of Professional Experience.
  • Your two interesting points – a Moodle forum in the last week of new content. The last week before the students go on Professional Experience. The students are asked to share in this forum the two points that resonated most with them from the previous reading that was made up reflections of prior students about Professional Experience.
  • Pragmatic advice on assignment 3 – another Moodle book with fairly specific advice about how to prepare and complete the 3rd assignment (should generate some interest, you’d think).
Group Clicks / Student % Students
Overview and expectations
6 GPA 1.7 90.9
5 GPA 2.4 75.5
4 GPA 1.6 65.7
Less than 4 0.8 50.0
Your two interesting points
6 GPA 1.2 63.6
5 GPA 1.0 55.1
4 GPA 0.6 34.3
Less than 4 0.2 14.3
Pragmatic A3 advice
6 GPA 1.5 90.9
5 GPA 1.4 73.5
4 GPA 1.0 60.0
Less than 4 0.6 42.9

The established pattern linking GPA with usage largely remains. However, the “5 GPA” students buck that pattern with the “Overview and Expectations” book. The “gap” between the top group and the others is also much lower with the other two resources (0.2 and 0.1 click / student) compared to some much larger margins with earlier resources.

There is also a drop off in groups toward the end of semester as shown in the following table comparing the main Assesment link with the pragmatic A3 advice.

Group Assessment Prag A3 advice
  C / S % studs C / S % studs
6 GPA 22.7 100.0 1.5 90.9
5 GPA 12.2 75.5 1.4 73.5
4 GPA

11.0 74.3 1.0 60.0
Less than 4 8.2 64.3 0.6 42.9

Some “warnings”. The 10% drop for the “6 GPA” group represents 1 student. There’s a chance that by the end of semester, the students have worked out they can print out a Moodle book (can be used to produce a PDF). So they visit it, save the PDF and refer to that. This might explain the drop off in clicks / students.

References

Beer, C., Jones, D., & Clark, K. (2009). The indicators project identifying effective learning, adoption, activity, grades and external factors. Same places, different spaces. Proceedings ascilite Auckland 2009. Auckland, New Zealand. Retrieved from http://www.ascilite.org.au/conferences/auckland09/procs/beer.pdf

Dawson, S., McWilliam, E., & Tan, J. P. L. (2008). Teaching smarter: How mining ICT data can inform and improve learning and teaching practice. Melbourne. Retrieved from http://www.ascilite.org.au/conferences/melbourne08/procs/dawson.pdf

Analysing EDC3100 using MAV

Now that I have the Moodle Activity Viewer (MAV) working, I can continue the analysis of the course I teach, EDC3100, ICTs and Pedagogy. This post documents some reflections on the existing collection of activities and resources in the course informed somewhat by the insights provided by MAV.

This rather long image shows MAV’s modification of the semester 1 course site for EDC3100. In the following I’ll be focusing on the Semester 2 offering as its the latest and greatest version. The shortcoming of analysing this offering is that it’s only taken by on-campus students.

I’ve only completed the first 2 weeks, I’ll update this post as I work through the other weeks.

Some additional background

91 students completed all of the assessment. Another 9 students did not complete the course. In the following I’ll assume 91 as representing 100% of students.

The semester 2 course is divided into a structure similar to what’s shown in the S1 image i.e.

  1. Top of the course site divided into some generic links/information, an image that changes weekly, and direct links to the discussion forums.
  2. Each topic/module of the course equates to a week of semester.
  3. There’s a navigation bar at the top to help students go straight to a particular week.

Completion of the all the provided activities and resources forms a small part of the assessment of the course, so I expect most students to have used most of the weekly activities and resources.

Some user feedback on MAV

Misc. feedback/ideas on using MAV that have arisen during the following analysis

  • Keeping MAV configuration specific to the browser window?

    In the following, I wanted to explore both the number of clicks and the number of students using each resource. I had two windows open, one configured to show clicks, one to show students. The problem is when I reloaded a page or visited another, MAV would use the configuration settings most recently set.

  • And/Or, Having the MAV configuration link appear on all pages OR add it to the heat map legend.

    I know this is difficult. But part of the problem is when I’m viewing a book or a forum, I want to be able to switch between students/clicks. Perhaps the better solution is to add the configuration link to the heatmap legend.

  • What’s the relationship between all links associated with a resource/activity?

    e.g. let’s say I have a Moodle book. There’s one link into the book on the course page, but there are numerous links within the book. Going between different pages, chapters and also using various services (e.g. print the book).

    MAV shows some stats on the course page, what does these stats show? The total number of all usages of that resource, including all the internal links? Or, as I suspect, just the stats for that particular link? How might this influence usage? What happens if the students book mark a particular page within the book and use that?

  • Would be useful to have heat maps generated based on activity completion – so I could see who has/hasn’t at a glance.
  • Have a roll over that reveals students who haven’t completed/clicked on an activity/resource
  • The idea of an abstract model for the MAV communication enabling a range of pluggable modules.
  • Identifying the “geology” (as in data geology, rather than data mining) for different pages.
  • Having the groups work as either Union or Intersection.

    e.g. have groups based on a students GPA and groups based on their mode of study is a context where it would be useful to have an intersection of the two groups. i.e. all of the “6 GPA” + Online students.

  • Adding the values “Clicks / student” and “% students” rather than just the raw counts.

    Allows slightly more valid comparisons between groups.

  • The option to produce spreadsheets with the raw data to enable analysis.

Top of the course

MAV only appears to pick up the normal Moodle links (those created when you add an activity or resource), many of the links in this section are manually entered into HTML so no immediate insight into their usage.

For the discussion forums, MAV reports

  • News forum – announcements from me – 495 clicks by 62 students.
  • General Q&A forum – 977 clicks from 76 students.
  • Assignment 1 forum – 774 clicks from 92 students.
  • Assignment 2 forum – 599 clicks from 86 students.
  • Assignment 3 forum – 949 clicks from 86 students.

Given 100 students enrolled in the course at the end of semester, I wonder if the 8 students who didn’t use the assignment 1 forum are those that didn’t complete the course. Similarly, I wonder about the 5 students who didn’t access the assignment 2 and 3 forums, did they pass the course? How well did they do?

The drop in use of the Assignment 2 forum is not a big surprise. Assignment 3 is directly tied to students going into schools to teach, this focused the mind somewhat. Assignment 1 has them creating an online artefact and is quite challenging. There are also queries about blogs and requirements. Would be useful to check these assumptions.

Can also grab stats for some of the other links (mostly “hidden” resources) via other means

  • Study Schedule – Page (340 clicks, 93 students)
  • Assessment – Book (1559 clicks, 97 students)

    A Moodle book containing all the assessment details for the course. Not surprising that it’s one of the more heavily used resources/links.

    A nice thing about MAV is that it also produces the same “heat map” display on all links on all Moodle pages. e.g. if I click into this Moodle book I can then see all the other clicks that students have made within this book. For example, there are three separate pages for each assignment with the following stats: assignment 1 (741 clicks, 97 students), assignment 2 (755 clicks, 97 students), assignment 3 (848 clicks, 97 students)

  • Professional Experience – Page (701 clicks, 94 students)
  • On-campus material – Book (146 clicks, 59 students)

    This book contained recordings of on-campus lectures from S1. Doesn’t appear to be heavily used. Do we need it?

  • Meet the teaching team – Page (155 clicks, 95 students)

    Would appear they used it once at the start of semester, but were fine without it from then on. Is this the case? Should this stay here?

  • Professional experience slides – File (64 clicks, 50 students)

    Powerpoint provided by others meant to summarise requirements for PE. Interestingly, amongst the lowest used resource.

Further questions/tasks

  1. Can I get usage figures for the weekly navigation links?
  2. Can I get usage figures for the Course Content block?
  3. Are the at least 8 students who didn’t visit the Assignment 1 forum those that ended up not completing the course?
  4. Who and what happened to the 5 students who didn’t access the assignment 2 or 3 discussion forums?
  5. Can the weekly image be incorporated into each week’s section?
  6. Let the PE office know about the usage of the slides?
  7. Are the 97 students who viewed the assessment book the core group? What happened to the apparent 6 students who looked at the assessment page, but didn’t complete the course? Are there any students who passed the course who didn’t look at the assessment page? What about the at least 3 students who did not look at the assessment page and failed the course?

Course overview

This is intended as an orientation to the course. To be completed during O-Week. I don’t necessarily expect all students to have completed these. It’s not required.

Contents include the following (the word – e.g. Page – after the name of the activity/resource is the Moodle name for the type of activity/resource)

  • Welcome to the course – Page 139 clicks, 91 students

    A bit of text and a pointer to a Vimeo video (lecture). Vimeo stats reveal 304 plays, but I believe I used this same video in S1. Vimeo reveals a peak of 26 and 28 views per week in July 2013. About the time S2 was getting underway. The content is not that useful. Limited in scope due to S1 implementation and not much being known about the course.

  • How will the study desk be used this semester? – Page 130 clicks, 94 students

    Another page with some vimeo videos. Giving an overview of the study desk, it’s construction and how it will work. Jesus the narration is crappy. Vimeo reveals 255 plays

  • About the pedagogy used in this course – Page 152 clicks, 90 students

    Another brief page with a link to a YouTube video on the networked student. Need to link some of this more explicitly to the activities, assessments etc in the course.

  • Meet the teaching team – Page – 155 clicks, 95 students

    Brief bio, photo and contact details for the staff.

  • What you should do to prepare for this course – Page 166 clicks, 93 students.

    Four other tasks students should complete – blue card etc.

Further questions/tasks

  1. All around the 90-95 student mark, was there any commonality in the students who didn’t access this material? What happened to them in the course?
  2. S1, 2014 – redo the introductory video.
  3. S1, 2014 – redo the study desk video.
  4. S1, 2014 – link the “pedagogy” page more to what students will do in the course.
  5. S1, 2014 – Make a stronger case for the assumptions underpinning the design of the course (yea, they’ll all read that!).
  6. S1, 2014 – make explicit connections to various professional standards etc.
  7. S1, 2014 – encourage students – where appropriate to get into the learning place?

Week 1 – ICTs, PLNs and You

  • Getting started
    • Introduction to the week – Page (177 clicks, 94 students)

      Simple intro

    • Setting up your tools: Diigo, a blog and Twitter Book (509 clicks, 97 students)

      4 page book outlining the tools that students will use during the semester for their learning: Diigo (452 clicks, 97 students), a blog (350 clicks, 97 students) and Twitter (158 clicks, 93 students). Interesting to see that the explicit “optional” tag for Twitter appears to have had an impact.

    • Register your blog Database (1211 clicks, 97 students)

      Where the students register their blog and also how they can view what other blogs are registered (encouraged to do this). Good to see that the clicks suggest that they were coming back to this. May hopefully be replaced by BIM.

    • Introduce yourself Book (384 clicks, 96 students)

      3 page block explaining the “intro” activity. 2nd page (280 clicks, 95 students), 3rd page (141 clicks, 94 students). Why the 140 click difference, but only 1 student? Were the instructions that difficult?

    • Share your introductions Forum (574 clicks, 96 students)
    • Where the students are meant to post their introductions. This is where MAV is particularly interesting, so much so it sparked another blog post. In short, I need to revisit this activity.

  • Overwhelmed? Toolbelt theory, PKM and reflection
    • PKM and Reflection Book (285 clicks, 94 students)

      5 page book introducing the core of what the students should be doing this semester. There is a drop off in clicks with each of the pages, but all 94 students visited each page. Suggesting that the PKM (332 clicks) is something students are coming back to. While at the other extreme “Using Theories” (196 clicks) is not.

    • Toolbelt theory Book (350 clicks, 94 students)

      11 page book (some of the pages in these books are a couple of paragraphs) introducing Toolbelt theory. i.e. trying to get students to actively engage with how ICTs are just tools that can help them solve problems. Applies this first to their own pracitce (e.g. Google scholar and the USQ library). Also introduces Diigo and has the students use this to annotate @irasocol’s toolbelt theory blog post.

      Usage of the pages of the book trail off. 94 students down to 90 in the middle. 366 clicks down to 153 clicks. This is perhaps suggesting that Moodle’s activity completion may be too straight forward for the Moodle book.

    • Seek, Sense, Feeds, Feed readers and blog posts Book (352 clicks, 89 students)

      7 page book getting students into using Feedly and following the blogs of other students. Decrease from 91 students down to 87 and 402 clicks down to 141.

  • ICTs and Conclusions
    • What are ICTs? Book (276 clicks, 93 students)

      5 page book trying to get the students to identify what ICTs are. Going more broadly than computers. Includes a reading, a video and a “what have you used” question.

      93 students down to 90.

    • What ICTs did you see in Hello Kitty? Forum (308 clicks, 90 students)

      Students are asked to identify a list of all the ICTs they say in a “Hello kitty in space” video. A Moodle Q&A forum, they can’t see the responses of others until they’ve shared their own.

      89 students, 93 replies and 406 clicks – will be interesting to explore this further – the difference between the different types of forum.

    • Finishing up for the week Book (274 clicks, 91 students)

      Mish mash of 4 page book. “Why would you use ICTs” a link to Assignment 1 and encouraging the students to think about why they would use ICTs. Encouragement to seek, sense, share and encouraging them to record all the ICTs they see as the semester progress. Lastly, get them to reflect on where they are up to using a frameworks of ICT usage.

      92 down to 91. 186 clicks down to 158.

    • How are you going with the course? Page (137 clicks, 90 students)

      A moodle page with a link to a course barometer.

Further questions/tasks

  • S1, 2014 Should we drop the mention of Twitter being optional. Don’t make it part of assessment, but don’t suggest it’s optional?
  • S1, 2014 Will/can the register blog database be replaced with BIM?
  • S1, 2014 Redesign the introduction forum activity to encourage more connections between students (none really happening at the moment).
  • Think about how PKM can be used to better scaffold blog posts etc.
  • Explore if the Moodle activity completion for a book only requires clicking on the initial book, not reading all of the pages.
  • S1, 2014 Modify the Feeds and Feedly book based on whether BIM is used. Consider also whether this might be combined with the “introduction” activity.
  • S1, 2014 Reconsider the reading for the “What are ICTs” section to find something that engages with broader categories, is less academic and has more scope for creativity (easy right?).
  • Do the different types of Moodle forums (different pedagogical intent usually) show different usage patterns?
  • S1, 2014 Can the “Where are you situated” query be moved to before the introduction and then integrated into it?
  • S1, 2014 The “why use ICTs” can perhaps be expanded?
  • S1, 2014 Can an activity be added to “seek/sense/share” an explicit prompt?
  • S1, 2014 Update the course barometer page with results from last year – perhaps do a comparison between the various offerings?

Week 2 – ICTs and Pedagogy

  • Getting started
    • Register for Scootle – Page (191 clicks, 93 students)

      Getting the students to register for Scootle.

    • Introducing week 2 – Book (198 clicks, 91 students)

      3 page book explaining the week. Includes them selecting a mind mapping tool that they’ll use during the week. Fairly consistent usage, the mind map page has more clicks.

  • ICTs and Change
    • Examples of how the world is changing – Book (205 clicks, 92 students)

      4 page book showing off various “did you know” type videos illustrating how the world has changed, in part due to ICTs.

    • Understanding technological change – a first step – Book (409 clicks, 93 students)

      8 page book with an activity based around Postman’s 5 things to know about technology.

      Clicks down from 394 to 292. 91 students down to 89.

    • Examples of Postman’s five things we need to know. – Forum (369 clicks, 91 students)

      Forum where students’ share their examples of personal experience of one of Postman’s 5 things.

      Students do tend to be sprinkled across the different “things”. Not a lot of checking out the other “things”. Students also tending to start their own threads which tends to dilute things.

  • What is “ICTs and Pedagogy”?
    • The importance of pedagogy – Book (198 clicks, 93 students)

      6 page book aimed at some high level points about using ICTs and pedagogy. e.g. this cartoon, definition of pedagogy. No drop off in students. Some drop off in clicks. What is pedagogy gets the most!.

      Leads to an activity where the students are asked to share a pedagogical technique that they are aware of.

    • What is “pedagogy” in your teaching area? – Forum (249 clicks, 90 students)

      A forum where the students share their pedagogical knowledge as asked in the last book.

      Similar patterns to other forums. Lots of threads. Limited reading of other people’s posts.

    • Approaches to ICTs for Learning – Book (344 clicks, 92 students)

      1 page book asking students to read and then share one example of ICT usage from the Luckin report.

    • Examples of ICTs for learning – Forum (342 clicks, 88 students)

      Forum with fixed number of threads. Where students have to share their example ICT usage from the previous book.

      Somewhat better replies/students ratio. 7 replies/24 students clicking on it. 26 replies/47 students. This is interesting. Suggests students are perhaps finding this useful or valuable.

    • ICTs and the Curriculum – Why and Digital Resources – Book (252 clicks, 91 students)

      Three page book linking with the Melbourne Declaration, Australian Curriculum and Scootle. They have to find a useful resource on Scootle as part of this book.

      Consistent use through out. Practical relevance?

    • Share your Scootle Resources – Forum (313 clicks, 84 students)

      Forum where students are asked to share the Scootle resource they found.

      Similar usage patterns to the introduction forum. Very similar.

  • Assignment 1, Connections and Conclusions
    • Your online artefact – Assignment 1, Part 2 – Book (277 clicks, 92 students)

      4 page book looking at A1 questions. Drop off in clicks, but not students.

    • One process for planning an online artefact. – Book (247 clicks, 91 students)

      Example of creating an online artefact. Big drop off in clicks 247 down to 135. 91 to 87 students.

    • Following EDC3100 blog posts – Book (157 clicks, 87 students)

      More about following blog posts of other students.

    • Share your concept map – Forum (267 clicks, 70 students)

      Forum where students share their concept map. Each thread has more people looking at them. Tied to assignment, so students see value in checking out what others are thinking.

    • What’s next? – Page (118 clicks, 86 students)

      Single page finishing up for the week. Another barometer.

Further questions and tasks

  1. S1, 2014 Should the Scootle registration be moved into the orientation/week 1 activities?
  2. S1, 2014 The last page of the “Examples” book needs to be updated to give some background on the apocryphal nature of the quotes used in the “What if?” video. Use this to lead into the whole “don’t trust everything” I tell you spiel. Lead into mention of learning styles?
  3. S1, 2014 Design a better activity around Postman’s 5 things. Some aims include: bringing considerations back to ICTs and Pedagogy; having students look at other “things”; and, having more checks on people’s understandings of the “things”. e.g. have the students respond to a post in another “thing” and comment on it.
  4. S1, 2014 Can the “how you use it that counts” page have an activity added to encourage the students to identify areas of their pedagogy that can be improved?
  5. S1, 2014 Extend the “sharing” pedagogy activity by asking students to find a technique offered by someone else and to suggest how ICTs might be used to help/modify it? Or perhaps combine it with the Luckin reading, e.g. connect one example/theme from Luckin with the pedagogy shared by another student.
  6. Are the ratios of reply/student clicking reply/clicks potential indicators of a good/sharing discussion forum? Relationship with SNA?
  7. Investigate why the ratio for the “Examples of ICTs” forum are better than others.
  8. S1, 2014 link the Melbourne Declaration – creative/productive use of ICTs to the toolbelt theory idea. Perhaps use this as a spark to do a @courosa lip-dub project. The lip dub idea could link to assignment 1 and artefact creation.
  9. S1, 2014 rework the share a Scootle resource forum. Maybe this becomes a resource to use in a later week. i.e. find someone else’s resource and evaluate it with SAMR. Could do this via a Google spreadsheet/Moodle database?
  10. S1, 2014 move the “Following blog posts” to first week.
  11. S1, 2014 Fix spelling of “your” in concept map forum name. Think about re-design of this.

Week 3 – Building your TPACK

  • Getting started
    • It’s not the technology, it’s how you use it – Book (212 clicks, 92 students)

      5 page book, tail wagging the dog, law of instrument, edudoggy and redbubble. Essentially trying to make students aware of some of the limitations of how people think about technology.

      212 down to 169 clicks, maintain student numbers.

      Some of this is an introduction to this week. Much of this is the use of quotes and phrases to push a perspective, there’s nothing in terms of activities to reinforce the point or even connect it to the student. It points to some articles about iPads, but doesn’t have an activity around it. The RedBubble activity is almost an after thought – and doesn’t require the students to share it.

    • Using and growing your PLN Book (217 clicks, 92 students)

      8 page book involving the weather photo activity and encouraging students to build their PLN. The weather photo activity links with a later cyber-safety activity. Is also used to talk about digital photography

      217 down to 128 clicks. 92 down to 91 students.

      Not much in the way of encouraging connections between students.

  • More reasons for using ICTs
    • TPACK and SAMR – some models Book (284 clicks, 92 students)

      5 page book. Simple intros to TPACK and SAMR.

      284 down to 187 clicks.

      TPACK quote includes emphasis on “nexus of standards-based curriculum requirements, effective pedagogical practices, and available technologies’ affordances and constraints”. But doesn’t go into detail about what these are. I’m not sure many students connect these terms with stuff that impacts them. Especially affordances.

      Again this book doesn’t require the students to share their understandings of these concepts.

    • The ICT general capability and you Book (201 clicks, 90 students)

      9 page book covering the use of online resources, a touch of digital citizenship, the ICT capability in the Australian Curriculum and referencing requirements.

      201 clicks down to 127; 91 down to 83 students.

      Again, not many of these activities are getting the students to produce things in the open or make connections.

  • Finishing up
    • Some general advice on assignment 1 Book (293 clicks, 91 students)

      6 page book on assignment 1, not surprisingly, used slightly more.

Further tasks/questions

  • Why the drop off in students for the latter resources? What happened to those students?
  • S1, 2014 The initial book “It’s not the technology” needs to include some activities/a redesign that helps the students.
  • S1, 2014 The TPACK/SAMR book needs to improved through the addition of exercises/activities that engage the students with the readings/videos/concepts. In particular, connect the students back to their example from the decoding learning report and get them to explicate the TPACK connections and perhaps do similar with SAMR. Alternatively, get them to do this with someone else’s example.
  • S1, 2014 Start the TPACK/SAMR book with the mathematical imagery trainer video or some other concrete example.
  • S1, 2014 The idea of having them find a buddy to work with, not a strong group thing and perhaps only for specific weeks. Perhaps a random allocation? Do I want to bother?
  • S1, 2014 Strengthen the link with A1 from the “ICT general capability” book. Emphasise that the embedding the use of ICTs is also aimed at improving learning. Have some sort of Google spreadsheet/form where students grade their capability against the organising elements of the Oz curriculum
  • S1, 2014 Is there a link between the “referencing requirements for Assignment 1” in the “ICT general capabilty” book and assignment 1. i.e. include the requirements in the assignment page.
  • S1, 2014 The idea of each week having a “PLN”/regular tasks page that prompts students for engaging on their blog.
  • S1, 2014 Any good S2 assignment 1s to add to the samples?
  • S1, 2014 “The reasons” page from the assignment 1 book will need to be updated if I change the purpose of assignment 1.

Week 4 – Effective planning

Apparently, An overview of unit planning and developing the context, stage 1 (learning constructs, essential questions) and part of stage 2 (assessment criteria) of your unit.

  • Setting the scene
    • An EduDoggy reminder – Book (190 clicks, 91 students)

      3 page book. Draw a stickman, reading about what is success with ICTs in L&T.

    • How will you measure the success of ICT integration into your teaching? – Forum (193 clicks, 89 students)

      Students asked to post how they will measure success.

      One thread, 87 students made 339 clicks. Q&A forum, so couldn’t see what others had posted, until they posted.

    • Introducing Module 2 Book (206 clicks, 91 students)

      6 page book, introducing the new module and assignment 2.

      Max 318 clicks on the sample assignments page, down to 143.

  • First steps in planning your Unit of Work
    • Alignment and planning Book (215 clicks, 89 students)

      5 page book – backwards design etc.

      215 down to 158 clicks. Not much in the way of activity – is that next?

    • Getting started on your Unit of Work Book (271 clicks, 90 students)

      6 page book leading through the backwards design process.

      271 down to 152 clicks.

  • Curriculum + Assessment
    • Content Descriptors and Learning Constructs Book (211 clicks, 90 students)

      4 page book. Identifying learning objectives for the UoW

    • Sharing “constructing knowledge” and “transforming knowledge” constructs Forum (286 clicks, 85 students)

      Students share a constructing and a transforming objective for their UoW.

      A few more students haven’t done this task. There is a bit of looking at others. Again the assessment influence.

    • Australian Curriculum, ICTs and other resources Book (152 clicks, 90 students)

      4 page book on the Oz Curriculum. Fairly low clickage.

      Does it make sense for this to be here, after the last one? Is this really just about ICTs?

    • Finding your assessment criteria Book (184 clicks, 90 students)

      7 page book identifying the assessment criteria and rubric elements.

      Need to get the students to do something here.

Further work

  • Student numbers per resource down from 92 to 91 (max) and go as low as 85. Who are the students not completing why? Assignment 1 is due around now, are these the students who have stopped already?
  • S1, 2014 Update “Draw a stickman” from “An Edudoggy reminder” for the new semester. More stuff around the text.
  • S1, 2014 “Introducing Module 2” – update “changes in assignment 2” on the intro page.
  • S1, 2014 Any good S2, 2013 assignment 2s to add?
  • S1, 2014 Rather than have the learning journals based on posts made during particular weeks, have them based on particular questions. Or allow the students to nominate the week that they are for? i.e. multiple posts per question.
  • S1, 2014 Link back to sample unit plans on the “Desired Results” page of the “Getting started on your UoW” book – and in other parts in this book
  • S1, 2014 Think about more activities for the UoW book that encourages connection/sharing?
  • S1, 2014 What about a self-marked quiz for students to test their understanding of constructing versus transforming objectives? Perhaps as a Q&A forum?
  • S1, 2014 The “Finding objectives” page needs to connect learning objectives back to driving questions and identifying an interesting unit.
  • S1, 2014 Should the “Oz Curriculum” book be earlier? How do students find the learning objectives without some of this guidance?
  • S1, 2014 SHould be more mention of ideas linking ICTs to learninig objectives, the Oz Curriculum, the general capability and more. Need to get the students thinking more about how they’ll use ICTs. Link to TPACK – finding literature about the content area, also SAMR when analysing particular examples.
  • S1, 2014 Add an activity where the students have to establish a criteria for one of their selected learning objectives.

Week 5 – Developing your learning plan

  • Setting the scene
    • Where are we? Where are we going? Book (167 clicks, 92 students)

      2 page book – introduction/revision

    • Khan Academy and PCK Book (257 clicks, 91 students)

      Using Khan Academy to illustrate the PCK problem. i.e. Khan’s videos aren’t as good because he has less PCK.

      1 student drops off.

    • A little quiz (231 clicks, 88 students)

      A 3 question mathematics quiz testing simple math misconceptions. Of which less 50% of the S2 students got correct.

  • Designing and sequencing learning experiences
  • Learning experiences Book (247 clicks, 92 students)

    9 page book focused on helping the students develop learning experiences with ICTs embedded.

    247 down to 138 clicks. Down to 91 students

    Links back to sample assignments, discusses what a learning experience is. Two main parts? 1) Understand what is required for the unit plan. 2) Design good learning experiences.

  • Sequencing learning experiences Book (173 clicks, 91 students)

    5 page book about sequencing learning experiences.

    Clicks drop away to 119.

    Mentions DoL and others.

  • Additional material

    These are both “lectures” recorded by another member of staff.

    Originally used in the S1 offering, these don’t seem to be as required now that the rest of the resources are up and going. Definite drop off in usage. Though might be some repeats

    • EDC3100 Module 2 Week 5 Lecture File (41 clicks, 31 students)
    • EDC3100 Module 2 Week 5 Tutorial File (20 clicks, 18 students)
  • Finishing up for the week
    • How are you going with the course? Page (97 clicks)

      Link to the course barometer for this week.

  • Further work

    • S1, 2014 – fix the type in the topic heading.
    • S1, 2014 – fix up the phrasing on “The flipped classroom” from “Khan Academy”. Generally needs some improvement. Also fix up the heading for the quiz activity on “A quick quiz”
    • S1, 2014 – look at using the results from “A little quiz” in activities around assessment and reporting and data manipulation. some of this is done in the “Where are we and where are we going” book from Week 6
    • S1, 2014 – add a summary and discussion of the results from prior results to “A little quiz” into the “Khan academy” book. This section of PCK needs to be improved and linked better with the reading.
    • S1, 2014 – Check and harvest the stuff tagged with PCK CONTENT on the diigo group and integrate it back into the materials – actually it’s already there, but not in a great format. Consider if this should be done in a discusion forum (and/or blog) rather than diigo.
    • Is the missing student from the “learning experiences” book a task corrupter? Result?
    • S1, 2014 – Revisit the “Learning experiences” book and make explicit the two steps 1) what is a learning experience, and 2) designing good ICT rich learning experience. Perhaps use a specific sample(s) from past assignments and use those as concrete examples for both steps. Make more explicit the sources of learning experiences – i.e. advance organiser. Have students analyse the samples with SAMR and TPACK. Have them make suggestions about how to improve. Or perhaps have them pick on something in this course. Have them consider/be aware of how the capabilities of ICTs can change the task. Add activities that encourage students to apply the “where ideas come from” to their own UoW and share the ideas. Add in an illustration of the connections between essential questions and a sample UoW – perhaps do the same for other samples. Explain about the use of SAMR etc on the padagogy wheel. Have the students share their examples/applications of the TIP model to their UoW
    • S1, 2014 Think about the location of the sequencing learning experiences. May go before the actual learning experiences section. Talk to students about it not being a fixed thing. Can more activities/feedback be given here?

    Week 6 – Finishing your UoW

    • Getting started and some revision
      • Where are we and where are we going? Book (172 clicks, 89 students)

        7 page book. Situating where we are and what needs to be done.

        Usage remains somewhat consistent.

      • Yet another quiz (161 clicks, 88 students)

        The “larger” shape quiz.

      • Declarative and Procedural Knowledge Book (141 clicks, 88 students)

        8 page book – more examples of declarative and procedural knowledge.

        This will need to move back to week 4

      • What’s your best ICT-rich learning experience? Page (199 clicks, 88 students)

        Just setting up the discussion forum. Where the students share their best ICT LE. Th idea is that they will revisit this at the end of the week and seek to improve it.

      • Share you best ICT-based learning experience Forum (750 clicks, 84 students)

        Interesting drop in student numbers, while an increase in clicks. Which is probably due to it being used twice. The number of clicks per idea, isn’t high.

    • Assessment
      • Assessment – tasks, criteria and descriptors Book (182 clicks, 87 student)

        6 page book that helps the students with the rubrics and assessment tasks.

        Only 87 students using it.

      • Week 8 Recording of combined lecture/tutorial focus File (67 clicks, 42 students)

        Another on-campus lecture recording, also tutorial.

    • Finishing up
      • Enhancing your ICT-rich learning experiences Book (114 clicks, 72 students)

        13 page book trying to deepen the student’s use of ICTs in learning experiences.

        Much of this is very down on student usage – only 72. One page – the link back to the discussion forum is used more.

        Much of it repeats some of what’s gone before. Soem good stuff on “common stuff”. Revisits most of the frameworks (SAMR, Decoding Learning)

      • The essay Book (118 clicks, 86 students)

        3 page book talking about the essay. Greater use than the previous book, but still a little low.

    Further work

    1. s1, 2014 Update the “What does module 3 hold” (“Where are we and where are we going”) mention of what weeks various stuff is happening.
    2. S1, 2014 update the quiz results discussion in “Where are we and..” Expand the analysis section – leading into spreadsheets?
    3. S1, 2014 Move the declarative book back to week 4
    4. S1, 2014 Prepare a labelled image for the sample rubric and the component identification. Perhaps based on the example on the next page. Make explicit what is meant by the “components” in the activity on that next page.
    5. S1, 2014 Modify the “enhancing your ICT-rich LEs” by having an artefact (Word doc/Google doc) that students have to fill in for their ICT learning experience. And include space for them to come up with suggestions for improvements based on each of these. Perhaps work in another student working with them on this. That student will critique their existing idea and/or comment on the evaluation. Do an example with the example at the end of the book.

    Week 7 – PE Expectations and Design

    • Getting started
      • Where we’ve come from and where we’re going Book (174 clicks, 90)

        4 page book. Intro to the module and to assignment 3 and this week.

    • Professional Experience
      • Overview and expectations Book (223 clicks, 89 students)

        17 page book outlining what is required on Professional Experience.

        Observations page surprisingly down in numbers!

      • What do you know about Professional Experience Forum (204 clicks, 87 students)

        Q&A Forum where students are expected to show what they know about it.

      • Designing lessons and leadership Book (184 clicks, 88 students)

        10 page book talking more about what might be done on Professional Experience. i.e. designing lessons and leadership. The TIP Model page is accessed a lot – probably through references from other pages.

      • Water Warriors Book (77 clicks, 60 students)

        11 page book that describes a sample UoW produced by a previous student.

      • The actual “Water Warrior” resources Folder (30 clicks, 21 students)

        Contains resources from the sample UoW

    • Finishing up
      • What else do you want to know? Book (104 clicks, 86 students)

    Further work

    • S1, 2014: Update the “Where we’ve come from” stuff that mentions specific weeks to reflect S1.
    • S1, 2014 Update the stuff about the 2013 PE book in Expectations of PE.
    • S1, 2014 Should the learning place stuff be moved/removed? Fix up the layout of the observations page. Update mentions of the PE handbook (more detailed breakdown) – add link to the handbook?
    • S1, 2014 the student’s video used in “leadership” is no longer available. See if access can be gained or reframe this section. May want to broaden this into a bigger discussion/activities around what you can do within the constraints of PE. Perhaps bring in some of the sample reflection essays and what they found and make some points about the assignment and start pushing people to start thinking about how they will do the design. Push them to start thinking about Part B of A3.
    • S1, 2014 Has the TIP model already been introduced previously? If not it should be – brought into backwards design.
    • S1, 2014 The Herrington and Kervin work on authentic learning might be useful to push further.
    • S1, 2014 Bring in the YOTs like activity into this section based on a prior PE.
    • S1, 2014 Bring in sample assignments – including lesson plans – from prior students and supplement the water warriors. Perhaps even start with the Water Warriors stuff. Have the students using SAMR/TPACK/TIP etc to evaluate?

    Week 8 – Digital Citizenship

    • Getting started Book (207 clicks, 88 students)

      5 page book that gets the students using the Connect.ed resources and revisit the idea of digital citizenship.

    • Are you safe? Book (199 clicks, 87 students)

      Getting into the digital footprint question for pre-service teachers.

    • Share your posts on the Connect.ed resources Forum (291 clicks, 73 students)

      Students share their thoughts on the resources forum (blog posts) here. Need to rethink this as part of standard forum limitations.

    • It’s more than safety Book (133 clicks, 86 students)

      8 page book trying to move beyond the safety aspect.

    Further work

    • S1, 2014 Are the connect.ed links and resources still available?
    • s1, 2014 Fix the HTML on “This week” page in “Getting started”
    • S1, 2014 Add some contributing activity to the getting started thing prompt student engagement/reflection. Ideas for what they could do? What are the big issues in their contexts that might be of interest? How can they connect this to their curriculum? SOme of this is in a later book from this week.
    • S1, 2014 Any update on crunkbear? Add in an activity around memes? Update the “inadvertently sharing information” for me to show exactly where the image was taken. A google map. Add in an explicit link about this back to the weather activity from earlier in the semester.
    • Update on some of the example in the last book

    MAV, #moodle, process analytics and how I'm an idiot

    I’m currently analysing the structure of a course I teach and have been using @damoclarky’s Moodle Activity Viewer to help with that. In the process, I’ve discovered that I’m an idiot in having missed the much more interesting and useful application of MAV than what I’ve mentioned previously. The following explains (at least one example of) how I’m an idiot and how MAV can help provide a type of process analytics as defined by Lockyer et al (2013).

    Process analytics

    In summary, Lockyer et al (2013) define process analytics as one of two broad categories of learning analtyics that can help inform learning design. Process analytics provide insight into “learner information processing and knowledge application … within the tasks that the student completes as part of a learning design” (Lockyer et al, 2013, p. 1448). As an example, they mention the use of social network analysis of student discussion activity to gain insights into engaged a student is with the activity and who the student is connecting with within the forum.

    The idea is that a learning analytics application becomes really useful when combined with the pedagogical intent of the person who designed the activity. The numbers and pretty pictures by themselves are more valuable in combination with teacher knowledge.

    A MAV example – Introduction discussion forum

    I’m currently looking through the last offering of my course, trying to figure out what worked and what needs to be changed. As part of this, I’m drawing on MAV to give me some idea of how many students clicked on particular parts of the course site and how many times they did click. At this level, MAV is an example of a very primitive type of learning analytics.

    Up until now, I’ve been using MAV to look at the course home page as captured in this large screen shot. When I talk about MAV, this is what I show people. But now that I actually have MAV on a computer where I can play with it, I’ve discovered that MAV actually generates an access heat map on any page produced by Moodle.

    This includes discussion forums, as shown in the following image (click on it to see a larger version).

    Forum students by David T Jones, on Flickr

    This is a modified (I’ve blurred out the names of students) capture of the Introduction discussion forum from week 1 of the course. This is where students are meant to post a brief introduction to themselves, including a link to their newly minted blog.

    With a standard Moodle discussion forum, you can see information such as: how many replies to each thread; who started the thread; and, who made the last post. What Moodle doesn’t show you is how many students have viewed those introductions. Given the pedagogical purpose of this activity is for students to read about other students, knowing if they are actually even looking at the posts is useful information.

    MAV provides that information. The above image is MAV’s representation of the forum showing the number of students who have clicked each link. The following image is MAV’s representation of the number of clicks on each link.

    Forum clicks by David T Jones, on Flickr

    What can I derive from these images by combining the “analytics” of MAV with my knowledge of the pedagogical intent?

    • Late posts really didn’t help make connections.

      The forum is showing the posts from most recent to least recent. i.e. the posts near the top are the late posts. This forum is part of week 1, which was 15th to 19th of July, 2013. The most recent reply (someone posting their introduction) was made in Oct. Subsequent posts are from 7th to 10th August, almost a month after the task was initially due (the first assignment was due 12th August, completing this task contributed a small part of the mark for the first assignment).

      These late posts had really very limited views. No more than 4 students viewing them.

    • But then neither did many of them.

      Beyond the main thread started by my introduction, the most “popular” other introduction was clicked on 41 times by 22 students (out of 91 in the course). Most were significantly less than this.

      Students appear not to place any importance on reading the introductions of others. i.e. the intent is not being achieved.

    • Students didn’t bother looking at my Moodle profile.

      The right hand column of the images shows the name of the author and the time/date of the last post in a thread. The author’s name is also a link to their Moodle profile.

      MAV has generated an access heat map for all the links, including these. There are no clicks on my profile link. This may be because the course site has a specific “Meet the teaching team” page, or it maybe they simply don’t care about learning more about me.

    • It appears students who posted in a timely manner had more people looking at their profiles.

      This is a bit of stretch, but the folk who provided the last post to messages toward the bottom of the above images tend to have higher clicks on their profile than those later in the semester. For example, 19, 22, and 12 for the three students providing the last posts for the earliest posts, and, 1, 1, and 7 for the students providing the last post for the more recent posts.

    • Should I limit this forum to one thread?

      The most popular thread is the one containing my introduction (549 clicks, 87 students). Many students posted their introduction as a reply to my introduction. However, of the 122 replies to my post, I posted 30+ of those replies.

    In short, I need to rethink this activity.

    Implications

    I wonder if the networks between student blog posts differs depending on when they posted to this discussion forum? Assuming that posting to this discussion forum on time is an indicator of engagement with the pedagogical intent?

    If the aim behind an institutional learning analytics intervention is to improve learning and teaching, then perhaps there is no need for a complex, large scale enterprise (expensive) data warehouse project. Perhaps what is needed is the provision of simple – but currently invisible information/analysis – via a representation that is embedded within the context of learning and teaching and thus makes it easier for the pedagogical designer to combine the analytics with their knowledge of the pedagogical intent.

    Answering the questions of what information/analysis and what representation is perhaps best understood by engaging and understanding existing practice.

    @damoclarky needs to be encouraged to do some more writing and work on MAV and related ideas.

    References

    Lockyer, L., Heathcote, E., & Dawson, S. (2013). Informing Pedagogical Action: Aligning Learning Analytics With Learning Design. American Behavioral Scientist, 57(10), 1439–1459. doi:10.1177/0002764213479367

    #moodle Activity Viewer (MAV) and the promise for bricolage

    I’ve spent the last few days – on and off – getting the Moodle Activity Viewer installed on my local Moodle instance. There were two main reasons for doing this

    1. Analyse how students were using my 2013 course sites.

      This will be the topic of later posts.

    2. Lay the foundation for exploring MAV as a platform for bricolage.

      This is the topic of this post.

    Rationale

    Over recent months I’ve heard various statements of the form “We know all there is to know about online learning and teaching”. Statements that reflect the perspective that the provision of quality learning and teaching at universities is a tame problem. It typically arises from experts – be they instructional designers or information technologists – and from people in “leadership” positions. Those in “leadership” positions seem increasingly convinced that leadership is the design of a single solution/vision to a problem and the successful implementation of that vision.

    The problem is that by seeing “quality learning and teaching” as a tame problem they believe that it can be “solved in a linear fashion using straightfoward, reductionist, repeatable, sequential techniques”. As a consequence, you get the organisational decomposition of skills into different organisational units. This decomposition prevents connections between the disparate knowledge bases of technology, pedagogy, content and context. The difficulty (impossibility) of making these connections limits the capability of organisational learning and teaching to learn and improve.

    What’s worse is that the “tame problem” perspective results in the adoption and perception of technologies (e.g. the LMS) as immovable. This results in the situation where if the technology doesn’t well support a particular pedagogy, then you better change the pedagogy because changing the technology is too hard. Again limiting the capability of organisational learning and teaching to learn and improve its practice. It also leads to the problem identified by Ciborra (2002)

    ..if every major player in the industry adopts the same or similar applications, any competitive advantage evaporates.

    On a more personal level, all of this results in crappy systems that don’t actively help me improve the learning of my students.

    For me, using technology to improve learning and teaching is a complex or wicked problem. The type of problem where lots of small scale, rapid experiments are the best way forward. The infrastructure underpinning MAV seems to be the best current foundation to enable this.

    How MAV works

    MAV is a plug-in for the Firefox plugin that communicates with a MAV server that provides access to a database. It enables the modification of a web page produced by Moodle. Currently it will modify a Moodle course page by adding a heatmap representing how particular groups of students have used the resources and activities on the course page.

    It changes something that looks like this

    Without heat map by David T Jones, on Flickr

    Into something that looks like this

    EDC3100 S2, 2013 - heat map by David T Jones, on Flickr

    Now this is somewhat useful for a teacher wanting to understand how various aspects of a course site have been used (or not). It can be argued that this information is available via other means (e.g. Moodle’s activity report), but I’d suggest that the in-situ, colourful representation provided by MAV provides some additional affordances that the activity report doesn’t provide.

    MAV does this using the following process

    1. I visit my course’s home page in Moodle.
    2. MAV recognises this as a Moodle course page and adds an “Activity Viewer” option to the Moodle settings.
    3. If I’ve turned MAV on, MAV then sends a request to the MAV server asking for how many students or clicks there have been on all of the links on the course page.
    4. The MAV server queries a copy of the Moodle database and sends the results back to MAV.
    5. MAV changes the background colours for all of the links (or it can change the size of the text) to represent usage. MAV also adds some text with the actual number of clicks or students.

    But MAV’s real strength isn’t what it currently does, it’s how it could be used to support bricoloage.

    It’s on my computer

    The version of MAV that produced the above screen shots is running on my computer. The server is running on my computer. This means that I can write extensions to MAV to solve the problems I encounter when trying to support 300+ students in a course. If I come across a problem during semester, I currently have three options:

    1. engage in the heavy-weight processes associated with trying to get something changed in these systems (which probably won’t be able to be changed anyway); or
    2. implement some manual work around to solve the problem;

      e.g. create a zip file for each of the 60 assignments I marked and manually upload each one individually into the system.

    3. make do without.

    For example, the pre-service teachers who take my course come from a range of sectors including early childhood, primary, middle years, secondary (content specialisations) and vocational education. The type of response I should give to a question can depend on the pre-service teacher’s sector. The Moodle discussion forum will tell me the name of the person who asked the question, but it doesn’t provide any other information. In fact, it can’t because information about a pre-service teacher’s sector is very specific to Bachelor of Education students and so is not part of the information from the university’s student records system that is inserted into Moodle.

    It should be fairly easy to write a MAV extension that whenever it sees a student’s name, adds to the name the student’s sector. Perhaps even a mouse-over that shows a range of information about the student, perhaps including some personal annotations I’ve made about the student. Perhaps documenting (and reminding me of) the various unique complications that impinge on the lives of my students.

    With MAV (and my capabilities), I can implement this modification without having to engage in the heavy-weight institutional processes. I can engage in bricolage.

    This example probably doesn’t excite the learning theorists or instructional designers. It doesn’t offer any large change in the fundamental practice of pedagogy supported by an appropriately convoluted theoretical framework. It’s somewhat prosaic, simple, and only a very small change. But then such people don’t really get the concept of complex adaptive systems and bricolage (see below).

    An aside on requirements gathering

    I almost didn’t include the “pre-service teacher sector” example above. I found myself not being able to think of an example about how I might use MAV. This is not indicative of there not being a need for this sort of approach. It is indicative of limitations of human cognitive capabilities/memory and the stupidity of the assumptions underpinning traditional requirements gathering processes.

    My difficulty in identifying example arises from the observation that I’m not currently teaching the course. Asking for requirements when I’m not engaged in an activity, is always going to result in significantly fewer and less detailed requirements than asking me while I’m engaged in the activity or actively observing me. And yet, how do organisations gather requirements for new systems? Months or years before people actually start using the system, they ask people, “What would you like to do with this system?”

    The value of bricolage

    Of course bricolage is always frowned upon by organisational folk. Bricolage is messy. It can lead to the ultimate evil in organisational IT – shadow systems.

    But there is another perspective, again from Ciborra (2002)

    If these approaches look rough compared to neat and tidy formal procedures, they are on the other hand highly situated: they tend to include an added element of ingenuity, experience, and skill belonging to the individual and their community (of practice) rather than to organizational systems. Finally, they all seem to share the same way of operating: small forces, tiny interventions, and on-the-fly add-ons lead, when performed skilfully and with close attention to the local context, to momentous consquences, unrelated to the speed and scope of the initial intervention. These modes of operation unfold in a dance that always includes the key aspects of localness and time (the ‘here and now’); modest intervention and large scale effects; on-the-fly appearance but deeply rooted in the personal and collective skill and experience

    And drawing on research projects into Strategic Information Systems, Ciborra (2002) goes onto argue that

    The capacity to integrate unique ideas and practical design solutions at the end-user level turns out to be more important than the adoption of structured approaches to systems development or industry analysis

    and more directly for those who know the answers

    All these cases recount the same tale: innovative, strategic applications of IT are not fully designed top-down or introduced in one shot; rather they are tried out through prototyping and tinkering. In contrast strategy formulation and design take place within pre-existing cognitive frames and institutional contexts that usually prevent designers and sponsors from seeing and exploiting the potential for innovation hidden in the artefacts….SISs (strategic information systems) emerge when early adopters are able to recognize, in use, some idiosyncratic features that were ignored, devalued, or simply unplanned.

    References

    Ciborra, C. (2002). The Labyrinths of Information: Challenging the Wisdom of Systems. Oxford, UK: Oxford University Press.

    Powered by WordPress & Theme by Anders Norén

    css.php